
Last Updated on January 2, 2026 by Sam Gupta
A skilled inventory manager is one who carefully balances customer satisfaction with efficient capital management. Inventory managers take on the central role, overseeing the seamless flow of goods, optimizing stock levels, and ensuring the availability of the right products at the right time. Their responsibilities span from managing warehouse operations to refining procurement strategies, all geared towards enhancing the company’s overall performance.
Assessing the effectiveness involves measuring the KPIs for inventory managers, which act as valuable metrics for evaluating the success of inventory-related processes. Precision and efficiency are paramount in inventory management, necessitating to track specific KPIs for inventory managers which can provide insights into various facets of their operations. These metrics not only pinpoint areas for improvement but also empower inventory managers to make informed decisions that positively impact the company’s bottom line.
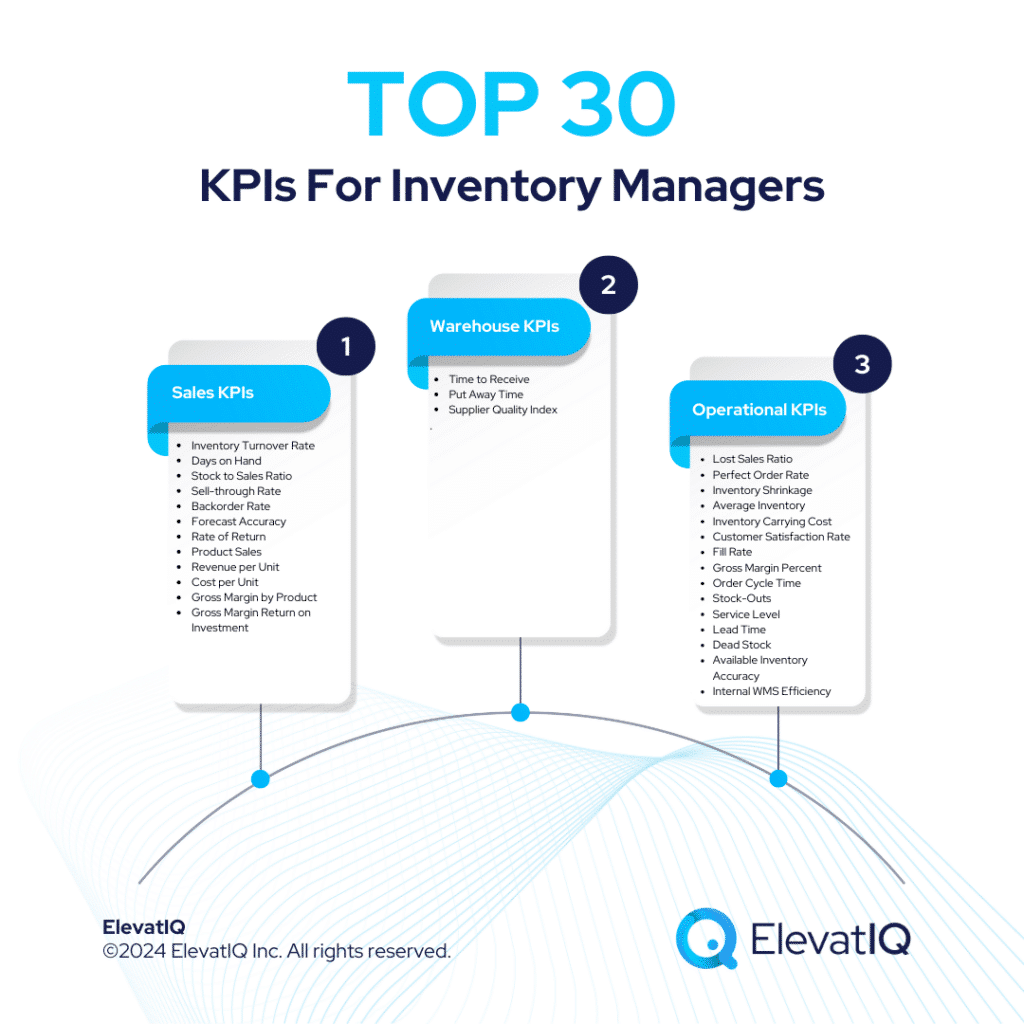
In this blog, we will discuss the top 30 KPIs for inventory managers that they should closely monitor. KPIs for inventory managers fall into three main categories: sales KPIs, receiving/warehouse KPIs, and operational KPIs. By comprehending and leveraging these metrics, inventory managers can streamline processes, elevate customer satisfaction, and contribute to the company’s overall success.
Sales KPIs For Inventory Managers
1. Inventory Turnover Rate
The inventory turnover rate is one of the sales KPIs for inventory managers that measures the number of times a company’s inventory is sold and replaced over a specific period, usually a year. A high turnover rate indicates that products are selling quickly, which is beneficial for cash flow and minimizing the holding costs of unsold items. Conversely, a low turnover rate suggests slow-moving inventory, tying up capital and potentially leading to obsolescence. This KPI is crucial for an inventory manager as it reflects the efficiency of stock management, helping them adapt strategies to align with market demands and optimize capital usage.
Inventory turnover rate = cost of goods sold / average inventory
2. Days on Hand
Days on hand is a sales KPI that measures the average number of days or weeks it takes to sell the current inventory. A low value signifies quick inventory turnover, which is positive for cash flow and reduces holding costs. On the other hand, a high value may indicate overstocking or slow-moving products, leading to potential obsolescence and tying up capital. These KPIs are vital for an inventory manager as they provide insights into the balance between stock levels and sales velocity, enabling strategic adjustments to align with market demands.
Days of inventory on hand = (average inventory for period / cost of sales for period) x 365
3. Stock to Sales Ratio
The sales KPI for inventory managers that compares the amount of stock on hand to the current sales volume is known as the stock to sales ratio. A high ratio may indicate overstocking, tying up capital, and potentially leading to increased holding costs. A low ratio could suggest potential stockouts, impacting customer satisfaction and sales revenue. For an inventory manager, maintaining an optimal stock to sales ratio is essential for ensuring inventory aligns with sales demand, minimizing holding costs, and maximizing profitability.
Stock to sales ratio = $ inventory value / $ sales value
4. Sell-through Rate
The sell-through rate is responsible for measuring the percentage of available inventory sold during a specific period. A high sell-through rate indicates efficient sales, minimizing the risk of overstocking and reducing holding costs. Conversely, a low sell-through rate may signify slow-moving inventory, potentially leading to obsolescence. This KPI is crucial for an inventory manager as it guides decisions on product promotions, pricing, and inventory replenishment strategies to optimize sales and prevent overstock.
Sell-through rate = (# units sold / # units received) x 100
5. Backorder Rate
This sales KPI for inventory managers measures the percentage of customer orders that cannot be fulfilled immediately due to insufficient stock. A low backorder rate indicates efficient inventory management, enhancing customer satisfaction. Whereas, a high backorder rate may result in lost sales and dissatisfied customers. For an inventory manager, minimizing the backorder rate is crucial for meeting customer demand, retaining business, and optimizing sales revenue.
Backorder Rate = (# delayed orders due to backorders / total # orders placed) x 100
6. Accuracy of Forecast Demand
The accuracy of forecast demand, a sales KPI for inventory managers evaluates how closely the forecasted demand aligns with actual sales. High accuracy suggests effective forecasting, minimizing stockouts and overstock situations. On the other hand, low accuracy may lead to inefficient inventory levels and potential lost sales. This KPI is vital for an inventory manager as it influences purchasing decisions, warehouse operations, and overall inventory optimization, ensuring resources are allocated efficiently.
Accuracy of Forecast Demand = [(actual – forecast) / actual] x 100


The 2026 Digital Transformation Report
Thinking of embarking on a ERP journey and looking for a digital transformation report? Want to learn the best practices of digital transformation? Then, you have come to the right place.
7. Rate of Return
The rate of return measures the percentage of sold items that are returned by customers. A low return rate indicates customer satisfaction and product quality. Conversely, a high return rate may suggest issues with product quality, leading to potential financial losses. For an inventory manager, monitoring the rate of return is crucial for maintaining customer satisfaction, identifying product issues, and implementing corrective measures to optimize sales and minimize returns.
8. Product Sales
Product sales is a sales KPI that represents the total units of a specific product sold within a given period. High product sales indicate strong market demand and successful product positioning and, low product sales may suggest the need for marketing adjustments or potential product obsolescence. This KPI is important for an inventory manager as it informs decisions on inventory replenishment, marketing strategies, and overall product lifecycle management.
9. Revenue per Unit
Revenue per unit calculates the average revenue generated by selling one unit of a product. High revenue per unit suggests effective pricing strategies and profitable product offerings. On the contrary, low revenue per unit may require pricing adjustments or a reevaluation of the product’s market positioning. For an inventory manager, understanding revenue per unit is crucial for optimizing pricing strategies, maximizing profitability, and making informed decisions about product offerings.
Revenue per unit = total revenue for period / average units sold for period
10. Cost per Unit
Cost per unit measures the average cost incurred to produce or purchase one unit of a product. Low cost per unit indicates efficient cost management, contributing to higher profit margins. Conversely, high cost per unit may impact profitability and require cost reduction strategies. For an inventory manager, monitoring cost per unit is essential for optimizing procurement strategies, negotiating with suppliers, and ensuring cost efficiency in the production or purchasing process.
Cost per unit = (fixed costs + variable costs )/ # units produced
11. Gross Margin by Product
Gross margin by product is a sales KPI for inventory managers which calculates the percentage of revenue retained after deducting the cost of goods sold for a specific product. A high gross margin indicates profitability, while a low margin may require a reevaluation of pricing or production costs. This KPI is vital for an inventory manager as it guides decisions on product pricing, procurement strategies, and overall product profitability, contributing to the company’s financial success.
Gross margin = [(net sales – cost of goods sold) / net sales] x 100
12. Gross Margin Return on Investment (GMROI)
Gross margin return on investment (GMROI), a sales KPI for inventory managers, evaluates the profitability of inventory investments by comparing the gross margin to the average inventory investment. A high GMROI indicates efficient use of capital and inventory profitability while a low GMROI may suggest the need for inventory optimization strategies. This KPI is essential for an inventory manager as it guides decisions on inventory investment, product assortment, and overall profitability, maximizing returns on capital employed.
Gross margin return on investment = gross margin / average inventory cost
Warehouse KPIs For Inventory Managers
13. Time to Receive
Time to receive is a warehouse KPIs for inventory managers which measures the average time taken to receive and store incoming inventory. A low time to receive indicates efficient warehouse operations, reducing the time products spend in transit. Conversely, a high time to receive may lead to delays in inventory availability. This KPI is important for an inventory manager as it impacts inventory replenishment speed, reducing the risk of stockouts and optimizing overall operational efficiency.
Time to receive = time for stock validation + time to add stock to records + time to prep stock for storage
14. Put Away Time
Put away time is a warehouse KPI for inventory managers that measures the average time taken to place received inventory into its designated storage location within the warehouse. A low put away time indicates efficient warehouse operations, reducing the time products spend in transition between receiving and storage. On the other hand, a high put away time may lead to delays in making inventory available for order fulfillment. This KPI is vital for inventory managers as it directly impacts the speed at which products become accessible for sale, minimizing the risk of stockouts and optimizing overall warehouse efficiency.
Put away time = total time to stow received stock
15. Supplier Quality Index
The supplier quality index is a warehouse KPI that assesses the quality of products received from suppliers. A high index indicates reliable and high-quality suppliers, reducing the risk of defects and returns. Conversely, a low index may suggest issues with product quality and supplier reliability. This KPI is crucial for an inventory manager as it influences supplier selection, inventory quality, and overall customer satisfaction, ensuring a seamless flow of high-quality products.
Supplier quality index = (material quality x 45%) + (corrective action x 10%) + (prompt reply x 10%) + (delivery quality x 20%) + (quality systems x 5%) + (commercial posture x 10%)
Operational KPIs For Inventory Managers
16. Lost Sales Ratio
The lost sales ratio is an operational KPI for inventory managers that measures the percentage of potential sales lost due to stockouts. A low lost sales ratio indicates effective inventory management, minimizing revenue loss. Whereas, a high ratio suggests the need for inventory optimization to prevent lost sales opportunities. This KPI is vital for an inventory manager as it highlights the impact of stockouts on revenue and guides decisions on inventory replenishment strategies.
Lost sales ratio = (# days product is out of stock / 365) x 100
17. Perfect Order Rate
Perfect order rate evaluates the percentage of orders that are fulfilled without errors. A high perfect order rate indicates efficient order processing and customer satisfaction. On the contrary, a low rate suggests issues with order accuracy, potentially leading to customer dissatisfaction and increased operational costs. This KPI is important for an inventory manager as it reflects the overall effectiveness of order fulfillment processes and guides improvements to enhance customer experience.
Perfect order rate = [(# orders delivered on time / # orders) x (# orders complete / # orders) x (# orders damage free / # orders) x (# orders with accurate documentation / # orders)] x 100
18. Inventory Shrinkage
Inventory shrinkage is an operational KPI for inventory managers that measures the loss of inventory due to theft, damage, or errors. A low shrinkage rate indicates effective security and inventory control measures. Conversely, a high rate suggests vulnerabilities in inventory management, impacting profitability. This KPI is crucial for an inventory manager as it guides decisions on security measures, inventory control, and loss prevention strategies, ensuring the integrity of the inventory.
Inventory shrinkage = ending inventory value – physically counted inventory value
19. Average Inventory
Average inventory calculates the average value of inventory during a specific period. A low average inventory suggests efficient stock turnover and capital usage. Whereas, a high average inventory may indicate overstocking and tie up capital. This KPI is vital for an inventory manager as it provides insights into the balance between stock levels and operational efficiency, guiding decisions on inventory optimization strategies.
Average inventory = (beginning inventory + ending inventory) / 2
20. Inventory Carrying Cost
Inventory carrying cost calculates the total cost of holding and storing inventory. A low carrying cost indicates efficient inventory management, minimizing expenses tied up in unsold stock while, a high carrying cost may suggest the need for inventory optimization to reduce financial impact. This KPI is crucial for an inventory manager as it influences decisions on inventory levels, storage solutions, and overall cost efficiency.
Inventory carrying costs = [(inventory service costs + inventory risk costs + capital cost + storage cost) / total inventory value] x 100
21. Customer Satisfaction Rate
Customer satisfaction rate measures the satisfaction of customers with the company’s products and services. A high satisfaction score indicates positive customer experiences, contributing to brand loyalty and, a low score may suggest areas for improvement to prevent customer dissatisfaction. This KPI is important for an inventory manager as it reflects the impact of inventory management on customer satisfaction, guiding improvements to enhance overall customer experience.
Customer satisfaction score = (# positive responses / # total responses) x 100
22. Fill Rate
Fill rate measures the percentage of customer orders fulfilled from available stock. A high fill rate indicates efficient order fulfillment, enhancing customer satisfaction. Conversely, a low fill rate may lead to backorders and customer dissatisfaction. This KPI is vital for an inventory manager as it guides decisions on inventory levels, order processing efficiency, and overall customer service improvement.
Fill rate = [(# total items – # shipped items) / # total items] x 100
23. Gross Margin Percent
Gross margin percent calculates the percentage of revenue retained after deducting the cost of goods sold. A high gross margin percentage indicates profitability, while a low margin may require adjustments to pricing or cost reduction strategies. This KPI is crucial for an inventory manager as it guides decisions on pricing strategies, procurement efficiency, and overall profitability, contributing to the financial success of the company.
Gross margin percent = [(total revenue – cost of goods sold) / total revenue] x 100
24. Order Cycle Time
Order cycle time measures the average time taken to fulfill a customer order from initiation to delivery. A low order cycle time indicates efficient order processing and quick delivery, enhancing customer satisfaction. Conversely, a high cycle time may lead to delays and customer dissatisfaction. This KPI is important for an inventory manager as it guides improvements in order processing efficiency, reducing lead times and optimizing overall operational performance.
Order cycle time = (time customer received order – time customer placed order) / # total shipped orders
25. Stock-Outs
Stock-outs measure instances where products are not available when customers demand them. A low occurrence of stockouts indicates effective inventory management, minimizing revenue loss and customer dissatisfaction. On the other hand, frequent stockouts may suggest issues with inventory optimization strategies. This KPI is vital for an inventory manager as it reflects the impact of inventory availability on customer satisfaction and guides decisions on inventory replenishment strategies.
Stock-outs = (# items out of stock / # items shipped) x 100
26. Service Level
Service level measures the percentage of customer demand that a company can fulfill. A high service level indicates effective inventory management, meeting customer demand, and enhancing satisfaction while a low service level may lead to lost sales and dissatisfaction. This KPI is crucial for an inventory manager as it guides decisions on inventory levels, order fulfillment strategies, and overall customer service improvement.
Service level = (# orders delivered / # orders received) x 100
27. Lead Time
Lead time measures the time taken from placing an order to receiving the inventory. A low lead time indicates efficient supply chain operations and quick product availability. Conversely, a high lead time may lead to delays in order fulfillment and potential stockouts. This KPI is important for an inventory manager as it guides decisions on supplier relationships, order planning, and overall supply chain efficiency.
Lead time = order process time + production lead time + delivery lead time
28. Dead Stock/Spoilage
Dead stock/spoilage measures the percentage of inventory that has become obsolete or spoiled. A low dead stock/spoilage rate indicates effective inventory management and minimizes financial losses. Whereas, a high rate may suggest issues with product demand forecasting or storage conditions. This KPI is vital for an inventory manager as it guides decisions on inventory levels, product lifecycle management, and overall inventory optimization.
Dead/spoiled stock = (amount of unsellable stock in period / amount of available stock in period) x 100
29. Available Inventory Accuracy
Available inventory accuracy measures the precision of inventory records in reflecting the actual available stock. High accuracy ensures reliable inventory information for decision-making while low accuracy may lead to errors in order fulfillment and operational inefficiencies. This KPI is crucial for an inventory manager as it guides decisions on inventory tracking systems, technology investments, and overall data accuracy, ensuring reliable information for optimal inventory management.
Available inventory accuracy = (# counted items that match record / # counted items) x 100
30. Internal WMS Efficiency
Internal WMS efficiency measures the effectiveness and accuracy of the internal warehouse management system. High efficiency ensures smooth warehouse operations and accurate inventory tracking. Conversely, low efficiency may lead to errors in order fulfillment and operational disruptions. This KPI is important for an inventory manager as it guides decisions on technology investments, system optimizations, and overall warehouse management, enhancing operational efficiency.
Internal WMS efficiency (ROI) = (gain on investment – cost of investment) / cost of investment
Conclusion
In conclusion, mastering the art of effective inventory management is essential for businesses. Skilled inventory managers play a central role in achieving this delicate balance between customer satisfaction and capital efficiency. The intricate responsibilities they shoulder, from overseeing seamless product flow to optimizing stock levels, contribute significantly to a company’s overall success.
Assessing the effectiveness of inventory management involves delving into KPIs for inventory managers. These are indispensable metrics that serve as a compass for evaluating the triumphs of inventory-related processes. These metrics serve not only to pinpoint areas for improvement but also to empower inventory managers with informed decision-making capabilities. Thus, ultimately influencing the company’s bottom line positively.
This blog has delved into the top 30 KPIs for inventory managers, categorized into three main dimensions: sales KPIs, receiving/warehouse KPIs, and operational KPIs. By comprehending and strategically leveraging these metrics, inventory managers can navigate the intricate landscape of inventory management. They can streamline processes, elevate customer satisfaction, and contribute substantially to the holistic success of the company.

+ 
ERP Implementation Failure Recovery
Learn how Frederick Wildman struggled with Microsoft Dynamics 365 ERP implementation failure even after spending over $5M and what options they had for recovery.
FAQs