
Last Updated on January 2, 2026 by Sam Gupta
In pursuing greater profitability and scalability, companies know the critical role production plays in transforming raw materials into finished products. However, production is not immune to challenges, ranging from delivery delays to defective units and product returns, which can significantly impact a company’s bottom line.
To tackle these challenges in the manufacturing industry, the role of a production manager is often pivotal, yet the roles and responsibilities can vary significantly across industries. Some companies might integrate this responsibility with an operations manager, while others in the manufacturing sector might have a dedicated position for a production manager. The roles of a production manager might also overlap with quality managers, with their primary responsibilities being managing production, managing schedules, and getting the maximum out of the production floor.
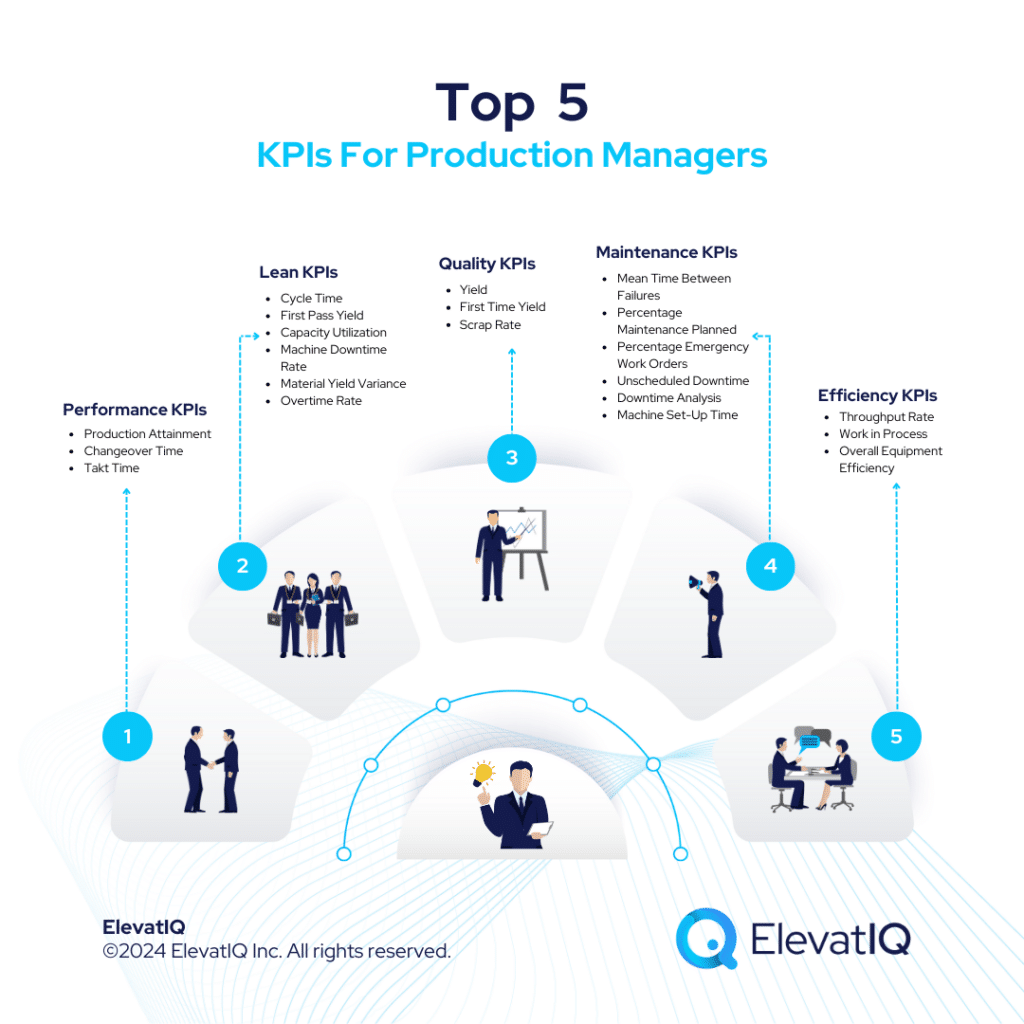
So, which KPIs for production managers are the most critical for the production manager role? To ensure they can keep track of production and maintain records of what is done correctly and incorrectly, a production manager should monitor these 5 specific KPIs for production managers.
Performance KPIs For Production Managers
Performance manufacturing KPIs for production managers include a set of key indicators designed to gauge and enhance the efficiency of the manufacturing process. These metrics serve as quantitative measures that reflect the effectiveness and productivity of the production floor. Within these metrics, three key performance indicators take center stage – production/schedule attainment, changeover time, and takt time. Let’s see what each of these KPIs means and what they indicate.
1. Production/Schedule Attainment
Production/Schedule attainment in manufacturing quantifies the extent to which actual production aligns with scheduled production targets. The manufacturing operation’s efficiency and its ability to meet predetermined production levels are measured by this metric.
Formula: Production attainment = (Actual production / scheduled production) x 100
A higher production attainment score signifies superior performance, indicating that the manufacturing process operates in sync with planned schedules. In practical terms, if a company aims to produce 100 units in a given time frame and achieves 95 units, the production attainment would be 95%, showcasing a commendable alignment with production goals. Conversely, a lower production attainment percentage suggests a divergence from scheduled targets, potentially indicating inefficiencies, delays, or challenges within the manufacturing process.
2. Changeover Time
Changeover time represents the duration required to transition a production line from manufacturing one product to another. This time interval encompasses the various tasks involved in the changeover process, such as equipment adjustments, line reconfigurations, and any necessary preparations to ensure optimal production of the new item.
Formula: Average changeover time = Total time to changeover production lines / # of changeovers
A lower average changeover time indicates a streamlined and efficient changeover process, allowing for increased flexibility in responding to shifts in production demands. For instance, if a manufacturing facility undergoes four changeovers with a total time investment of 240 minutes, the average changeover time would be 60 minutes. On the other hand, a high changeover time suggests inefficiencies in the transition process, potentially leading to production delays, increased downtime, and reduced overall operational agility.
3. Takt Time
Takt time is one of the fundamental performance manufacturing KPIs for production managers. It represents the pace at which a product must be completed to meet customer demand.
Formula: Takt time = Total available production time / average customer demand
A low takt time indicates a faster production pace, allowing the manufacturing process to keep up with or even exceed customer demand. This can signify a responsive and efficient production system, ensuring that products are delivered on time. Conversely, a high takt time suggests a slower pace relative to customer demand, potentially leading to production bottlenecks, delays, and an inability to meet market needs promptly.


The 2026 Digital Transformation Report
Thinking of embarking on a ERP journey and looking for a digital transformation report? Want to learn the best practices of digital transformation? Then, you have come to the right place.
Lean KPIs For Production Managers
Lean manufacturing KPIs for production managers are designed to evaluate the efficiency, productivity, and overall effectiveness of manufacturing processes within the lean manufacturing philosophy. These metrics are instrumental in identifying areas for improvement, minimizing waste, and optimizing resource utilization. Several critical KPIs fall under the umbrella of lean manufacturing metrics, such as cycle time, first pass yield, capacity utilization, machine downtime rate, material yield variance, and overtime rate. Each of them offers unique insights into different aspects of the production system.
4. Cycle Time
Cycle time refers to the average duration it takes to fulfill a customer order, serving as a crucial metric to gauge operational efficiency and customer responsiveness.
Formula: Cycle time = (Time customer received order – time customer placed order) / # total shipped orders
A lower cycle time suggests that the business can rapidly and effectively meet customer demands, reflecting streamlined processes and efficient workflows. For instance, if a company receives an order on Monday at 10:00 AM and delivers the product to the customer on Wednesday at 2:00 PM, with a total of 50 orders shipped, the cycle time would be (Wednesday 2:00 PM – Monday 10:00 AM) / 50, indicating the average time it takes to process and fulfill an order. On the other hand, a high cycle time may signal inefficiencies, potential delays, and a decreased ability to promptly respond to customer requests, which could impact customer satisfaction and competitiveness in the market.
5. First Pass Yield
First pass yield quantifies the proportion of non-defective products successfully manufactured without rework or scrap.
Formula: First pass yield = # of non-defective products excluding rework and scrap / total # of products manufactured
A high first pass yield indicates a robust and reliable manufacturing process, where most products meet quality standards on the initial attempt. This suggests efficiency, cost-effectiveness, and a minimized need for additional resources to rectify defects. Conversely, a low first pass yield suggests potential issues in the manufacturing process, such as inadequate quality control or inconsistencies in production.
6. Capacity Utilization
Capacity utilization quantitatively measures how much of a plant’s production capacity is actively utilized within a specific timeframe.
Formula: Capacity utilization = (Total capacity used during specific timeframe / total available production capacity) X 100.
A high capacity utilization percentage indicates that the manufacturing facility is operating efficiently and using its resources optimally. For instance, if a factory with a production capacity of 10,000 units produces 9,000 units monthly, the capacity utilization would be 90%. This suggests that the facility is running close to its maximum potential, leaving little room for additional production without expansion. On the other hand, a low capacity utilization percentage may signal underutilization of resources, inefficient production planning, or excess capacity.
7. Machine Downtime Rate
Machine downtime rate is one of the critical KPIs for production managers in manufacturing that quantifies the proportion of time equipment is unavailable for production due to both planned and unplanned downtime. This metric serves as a key indicator of equipment reliability, operational efficiency, and the effectiveness of maintenance practices.
Formula: Machine downtime rate = Total uptime / total uptime + total downtime
A low machine downtime rate suggests that machinery is consistently available for production, minimizing disruptions and ensuring a smooth workflow. Conversely, a high machine downtime rate signals frequent disruptions, potentially leading to production delays, increased costs, and a compromised production schedule.
8. Material Yield Variance
Material yield variance assesses the difference between the actual amount of material used and the standard amount expected for a given production process. This variance provides insights into the efficiency of material utilization during production.
Formula: Material yield variance = (Actual unit usage – standard unit usage) x standard cost per unit
A high material yield variance indicates that more material is being consumed than the predetermined standard, potentially signaling inefficiencies, waste, or deviations in the manufacturing process. Conversely, a low or negative material yield variance suggests that less material is used than the standard, potentially signaling cost savings and raising questions about quality or adherence to specifications.
9. Overtime Rate
Overtime rate measures the proportion of excess hours employees work beyond their regularly scheduled working hours. This metric provides valuable insights into workforce management, labor efficiency, and operational costs.
Formula: Overtime rate = (Overtime hours / total hours worked, including overtime) X 100
A high overtime rate suggests that a significant portion of the workforce is working beyond standard hours, potentially indicating high demand, tight deadlines, or understaffing. While this might signify a committed and flexible workforce, it can also increase labor costs, fatigue, and potential burnout. Conversely, a low overtime rate may suggest effective workforce planning and a balanced workload, contributing to employee well-being and cost control.
Quality KPIs For Production Managers
Quality manufacturing KPIs for production managers are specifically designed to measure and evaluate manufacturing processes’ overall quality and effectiveness. These metrics provide insights into various aspects of the production system, highlighting areas for improvement and ensuring that the final output meets or exceeds quality standards. Several critical KPIs fall under the umbrella, each addressing different facets of the manufacturing quality such as yield, first-time yield, and scrap rate.
10. Yield
Yield in manufacturing quantifies the efficiency of the production process by measuring the overall volume of products manufactured compared to the input of raw materials.
Formula: Yield = (Actual # of products manufactured / theoretical number of maximum possible yield based on raw materials input) X 100
A high yield indicates that the manufacturing process utilizes raw materials effectively, minimizes waste, and maximizes production output. Conversely, a low Yield suggests inefficiencies, waste, or issues in the production process, potentially leading to increased costs and reduced overall productivity.
11. First Time Yield
First time yield is one of the critical quality KPIs for production managers in manufacturing, serving as a key indicator of product quality and the efficiency of production processes. This KPI measures the percentage of non-defective or good units that are released without wasteful rework.
Formula: First time yield = # of non-defective or good units / total # of products manufactured
A high first time yield indicates that most products meet quality standards on the initial attempt, signaling an efficient and reliable manufacturing process. Conversely, a low first time yield suggests that many products require rework or correction, potentially indicating issues with material quality, equipment, or production processes.
12. Scrap Rate
Scrap rate quantifies the proportion of discarded materials during the manufacturing process. This metric provides insights into the efficiency of the production process, waste reduction efforts, and the utilization of raw materials.
Formula: Scrap rate = Amount of scrap material produced during a manufacturing job / total materials intake or put into the process
A low scrap rate indicates effective material utilization, minimized waste, and potential cost savings through efficient resource management. Conversely, a high scrap rate suggests inefficiencies, potentially resulting from production errors, equipment malfunctions, or poor-quality materials.
Maintenance KPIs For Production Managers
Maintenance manufacturing KPIs for production managers are designed to evaluate the effectiveness, reliability, and efficiency of maintenance processes within manufacturing operations. These metrics are instrumental in gauging equipment performance, minimizing downtime, and optimizing the maintenance strategy for enhanced productivity. KPIs like mean time between failure, percentage maintenance planned, percentage planned or emergency work orders, unscheduled downtime, downtime analysis, and machine set-up time, collectively fall under the umbrella of maintenance manufacturing metrics.
13. Mean Time Between Failures(MTBF)
MTBF is a crucial metric that calculates the average time a piece of equipment operates between failures. It provides insights into the reliability of production assets and is particularly useful for predicting maintenance needs.
Formula: MTBF = Operating time in hours / # of failures
A high MTBF suggests a reliable and robust system, minimizing disruptions and ensuring continuous production. Conversely, a low MTBF indicates frequent breakdowns, potentially leading to increased maintenance costs and decreased productivity.
14. Percentage Maintenance Planned(PMP)
PMP compares the total hours spent on planned maintenance activities with the overall maintenance time. It indicates the effectiveness of proactive maintenance planning.
Formula: Percentage planned maintenance = (# of planned maintenance hours / # of total maintenance hours) × 100
A higher PMP signifies a well-organized maintenance strategy, reducing unexpected downtime. Conversely, a low PMP may suggest a reactive approach, leading to increased unplanned downtime and potential production disruptions.
15. Percentage Planned or Emergency Work Orders
This metric compares the percentage of planned maintenance work orders versus those that are emergency or unplanned.
Formula: Percentage planned vs. emergency maintenance work orders = (# of planned maintenance hours / # of unplanned maintenance hours) × 100
A higher percentage of planned work orders indicates effective maintenance planning, reducing disruptions and optimizing resources. Conversely, a higher percentage of emergency work orders suggests a reactive approach, potentially leading to increased downtime.
16. Unscheduled Downtime
Unscheduled downtime measures the duration equipment cannot perform as scheduled due to reliability or equipment issues. It reflects the effectiveness of maintenance plans and the impact on production schedules. High unscheduled downtime can result in lost revenue and customer dissatisfaction.
Formula: Unscheduled downtime = Sum of all unscheduled downtime during specified time frame
17. Downtime Analysis
Downtime analysis is expressed as a ratio, reflecting the time equipment is not operational in relation to its total operating time. This metric is crucial for understanding the overall efficiency of equipment. A higher ratio indicates more downtime, potentially leading to decreased productivity.
Formula: Downtime in proportion to operating time = Total time equipment is down: Total time equipment is in operation
18. Machine Set-Up Time
Machine set-up time measures the duration required to prepare a machine for its next production run. A low set-up time indicates efficient changeovers and increased production flexibility. High set-up times can lead to production bottlenecks and decreased overall equipment effectiveness.
Formula: Machine set-up time = Time required to prepare machine for next run
Efficiency KPIs For Production Managers
Efficiency manufacturing KPIs for production managers are designed to measure and evaluate the effectiveness and productivity of manufacturing processes. These metrics focus on the throughput, work in progress, schedule attainment, and overall equipment effectiveness to ensure optimal performance and resource utilization within a production environment. The KPIs included under efficiency manufacturing metrics are throughput rate, work in process, and overall equipment effectiveness.
19. Throughput Rate
Throughput rate is a key performance indicator measuring the product volume produced within a specified time frame. It provides insights into the efficiency and productivity of a manufacturing process, allowing for analysis and comparison of similar equipment, production lines, or entire manufacturing plants.
Formula: Throughput rate = Total number of good units produced / specified time frame
A high throughput rate indicates effective production, efficient resource utilization, and optimal workflow. Conversely, a low throughput rate may signal inefficiencies, bottlenecks, or underutilized capacity.
20. Work in Process (WIP)
Work in process refers to goods in mid-production or awaiting completion and sale. This metric includes the raw materials, labor, and overhead costs associated with unfinished goods. WIP provides insights into the efficiency of material usage and the value of partially finished goods in production. A high WIP may indicate overproduction or inefficiencies in the production line, while a low WIP suggests efficient use of resources.
Formula: Work in process (WIP) = (Beginning WIP + manufacturing costs) – cost of goods manufactured
21. Overall Equipement Effectiveness(OEE)
OEE is a comprehensive metric that assesses the efficiency of equipment and machinery in the manufacturing process, considering factors such as availability, performance, and quality.
Formula: OEE = (Good Count × Ideal Cycle Time) / Planned Production Time
A high OEE indicates optimal equipment utilization and overall effectiveness in production. Conversely, a low OEE suggests potential issues in equipment efficiency, leading to increased downtime or reduced quality.
Conclusion
In conclusion, the role of a production manager is undeniably crucial in navigating the challenges of the manufacturing industry. It also ensures the transformation of raw materials into quality finished products. The multifaceted responsibilities of production managers can overlap with operations and quality managers. Thus, highlights the need for effective monitoring through KPIs. The top 5 KPIs for production managers discussed in this blog are performance, lean, quality, maintenance, and efficiency KPIs. They offer a comprehensive toolkit for production managers to gauge and optimize their operations.
By closely monitoring and optimizing these KPIs, production managers can steer their operations toward greater efficiency, improved quality, and enhanced competitiveness in the dynamic landscape of manufacturing. These KPIs for production managers serve as a compass, guiding them to make data-driven decisions, address challenges proactively, and ultimately contribute to their organizations’ overarching goals of profitability and scalability.

+ 
ERP Implementation Failure Recovery
Learn how Frederick Wildman struggled with Microsoft Dynamics 365 ERP implementation failure even after spending over $5M and what options they had for recovery.
FAQs