Acumatica vs IFS ERP Independent Review
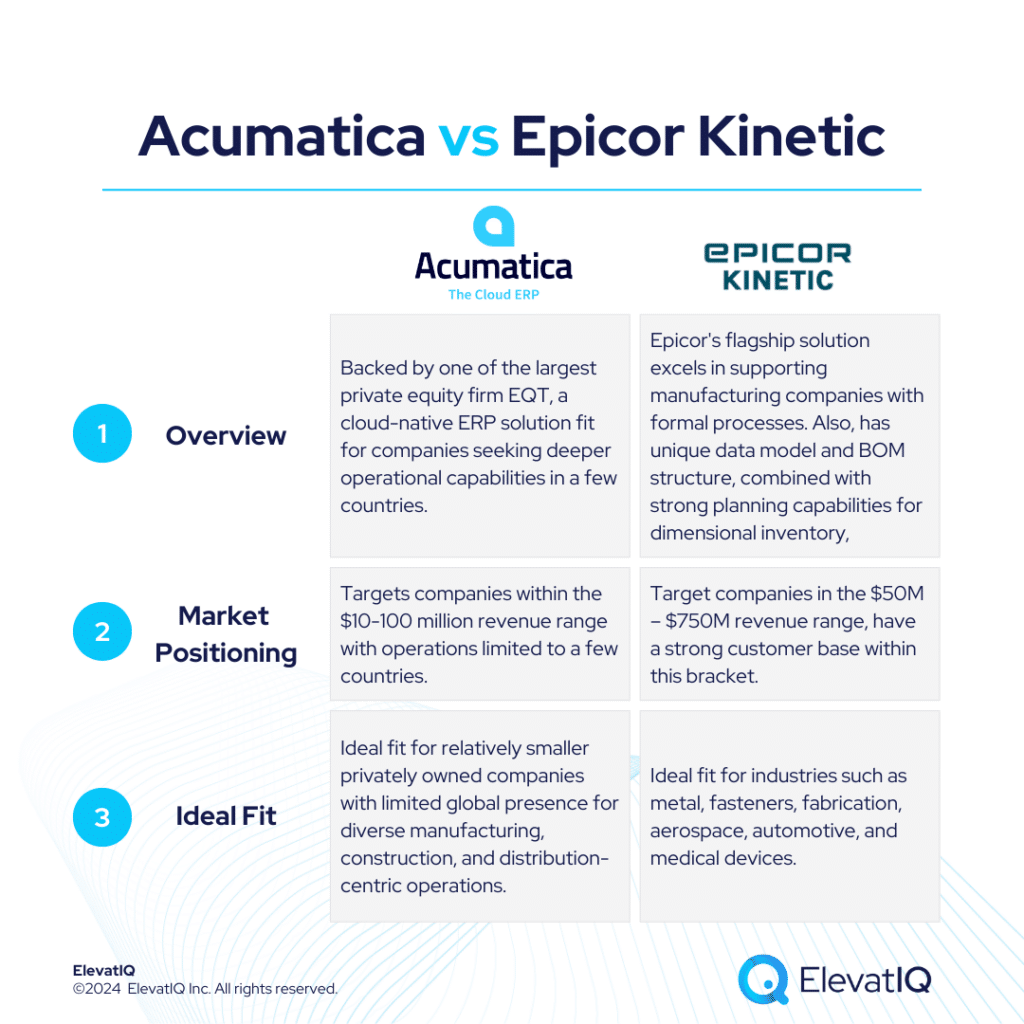
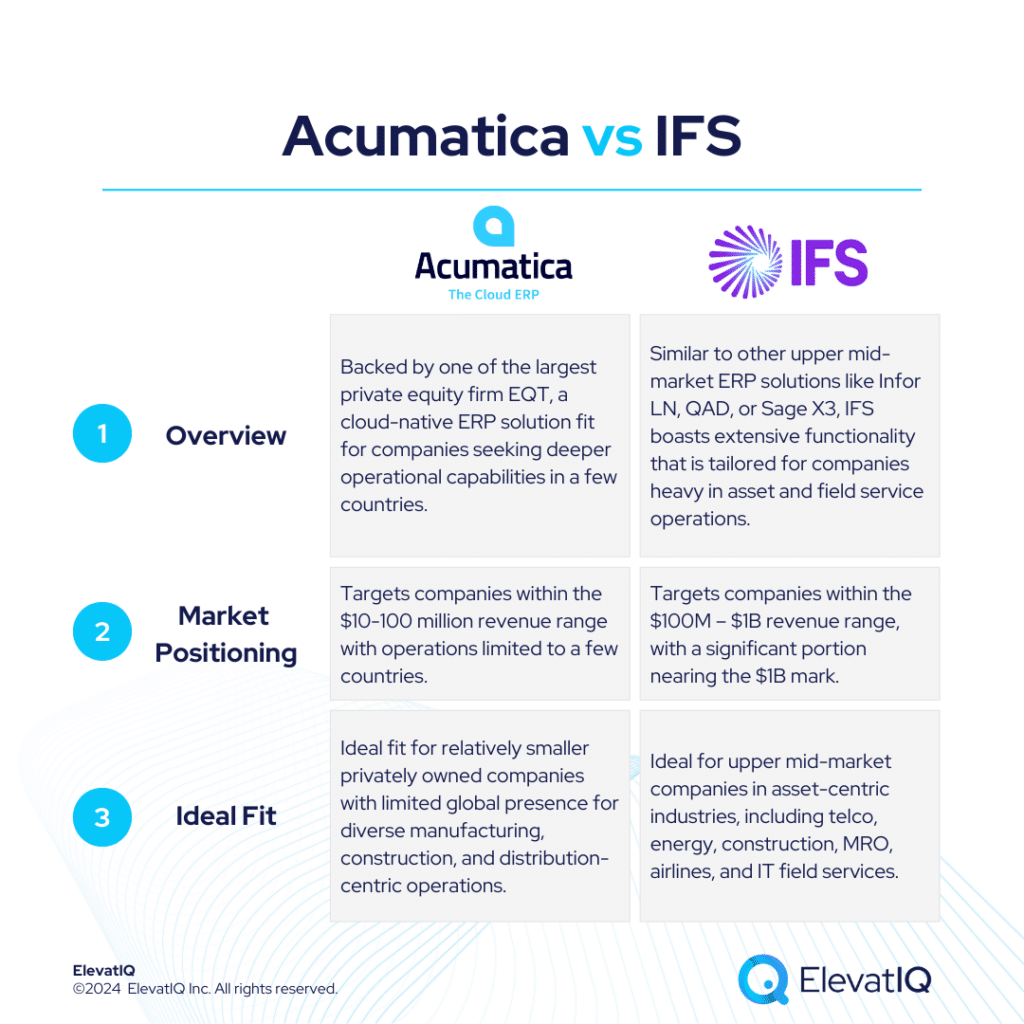
Acumatica stands out among three cloud-native ERP vendors particularly focusing on small and medium-sized businesses (SMBs), alongside NetSuite and Sage Intacct. On the other hand, similar to other upper mid-market ERP solutions like Infor LN, QAD, or Sage X3, IFS boasts extensive functionality that is tailored for companies heavy in asset and field service operations. Acumatica, however, caters well to companies with revenues ranging from $10-100 million, offering limited native localization features yet suitable synergies for global operations. Whereas, IFS is positioned for companies within the $100M – $1B revenue range, with a significant portion nearing the $1B mark.
Acumatica’s strength lies in its multi-branch capabilities and tailored support for various business models such as manufacturing, distribution, construction, and field service. On the other hand, IFS boasts robust global, multi-entity capabilities and operates as a cloud-native solution. IFS not only delivers functional capabilities but also efficiently manages the transactional workload of upper-mid-market companies.
Acumatica also serves as an excellent entry-level system for companies transitioning from QuickBooks or smaller point systems, seeking seamless cross-functional integration. On the other hand, IFS appeals to enterprises seeking mature, industry-specific capabilities, reducing the need for extensive development with vanilla ERP systems like SAP or Oracle. Therefore, choosing between Acumatica vs IFS requires a detailed examination, and this comparison offers valuable insights for ERP selection projects. Let’s delve deeper into the specifics.
| Acumatica | IFS | |
| Started in | 2008 | 1986 |
| Ownership by | EQT Partners in 2019 | EQT |
| No. of customers | 10,000+ | 6,500+ |


The 2026 Digital Transformation Report
Thinking of embarking on a ERP journey and looking for a digital transformation report? Want to learn the best practices of digital transformation? Then, you have come to the right place.
What is Acumatica?
Acumatica is one of three cloud-native ERP solutions particularly similar to NetSuite and Sage Intacct. It has extensive multi-branch capabilities, particularly making it friendlier for retail-centric operations. It can also host multiple business models as part of the same database spanning manufacturing, distribution, construction, and field service. Thus, making it friendlier for diverse manufacturing or distribution-centric operations. Because of its limited global operational capabilities, it primarily targets US and UK-based companies. Thus, positioned as an ideal choice for companies within the $10-100 million revenue range, the majority of Acumatica’s customer base falls under this category.
Desiring a user experience akin to Odoo or Quickbooks, Acumatica ERP also offers versatility to accommodate various business models: distribution, manufacturing, or construction-focused. Although Acumatica has limitations in mature features like dimensional inventory or allocation, it is an excellent initial system for companies looking to streamline inventory or costs. With transactional processing and some mature capabilities, such as batch transactional processing, Acumatica is positioned as a valuable choice for businesses venturing into their first or second ERP solution.
Acumatica ERP is a fit for companies seeking cloud-native experience, particularly emphasizing features like enterprise search and mobility over deeper operational capabilities. Despite its focus on small businesses, Acumatica lacks robust globalization and localization features, catering to a limited number of countries by default. This simplicity, however, benefits smaller companies by avoiding unnecessary layers of multi-entity operations. Although targeting small businesses, Acumatica ERP surpasses Odoo or Zoho with the flexibility of its data layers, necessitating consulting help for implementation. The perceived benefit of Acumatica’s pricing is also a challenge, as it’s notoriously difficult to understand and predict.
What Is IFS?
Similar to other upper mid-market ERP solutions like Infor LN, QAD, or Sage X3, IFS also boasts extensive functionality. This functionality is particularly tailored for companies heavy in asset and field service operations. Positioned uniquely in the market, IFS also appeals to enterprises seeking mature, industry-specific capabilities, reducing the need for extensive development with vanilla ERP systems like SAP or Oracle. IFS serves as an optimal alternative in the upper mid-market space, offering standalone best-of-breed asset management and field service capabilities or a comprehensive ERP solution meticulously crafted for asset-centric industries, including telco, energy, construction, MRO, airlines, and IT field services.
The IFS data model surpasses the complexity of smaller systems like Acumatica or NetSuite, demanding an experienced internal team and external advisory support to successfully align process and data codings with the intricate IFS data model. It is an ideal choice for upper mid-market companies outgrowing smaller systems, such as Acumatica or NetSuite, and requiring mature capabilities for enterprise-wide asset scheduling and maintenance. IFS not only delivers functional capabilities but also efficiently manages the transactional workload of upper-mid-market companies.
IFS boasts robust global, multi-entity capabilities and operates as a cloud-native solution. The majority of IFS customers fall within the $100M – $1B revenue range, with a significant portion nearing the $1B mark. While IFS has its roots in Europe, they have been trying to grow its presence in North America. In 2023, IFS made strategic acquisitions to enhance its AI and shop floor capabilities.
Acumatica vs IFS Comparison
Navigating the choice between Acumatica vs IFS is a significant decision for businesses particularly looking for operational efficiency and strategic alignment. Thus, this section delves into the comprehensive comparison of Acumatica vs IFS across various critical dimensions.
| Acumatica | IFS | |
| Global Operational Capabilities | Limited multi-entity capabilities. | Has robust global multi-entity capabilities. |
| Diverse Capabilities | Operationally rich for smaller companies, supporting various business models in one database. | Companies with a diverse business model, such as manufacturing or expecting changes with the model, might struggle. |
| Best-of-breed Capabilities | Limited, relying on third-party add-ons. | Has one of the strongest field service and asset management capabilities. |
| Last-mile Capabilities | May require add-ons for specific micro-verticals. | Often require add-ons for specific micro-verticals. |
| Operational Functionalities | Offers deeper operational capabilities and integration for smaller operations in fewer countries. | The operational capabilities would be deeper in some areas, making it a best-of-breed option for enterprise-grade asset and field service-centric use cases used alongside another ERP as a corporate ledger. |
| Integration Capabilities | Natively-integrated WMS functionality, lacks pre-integrated best-of-breed CRM, supports only embedded CRM. | Good fit for those seeking best-of-breed field service capabilities for a subsidiary or integrated with a corporate financial ledger. |
| Manufacturing Capabilities | Suitable for light manufacturing, limited mature capabilities. | Has comparatively limited manufacturing capabilities. |
| Pricing Model | Consumption-based, named, and concurrent but requires long-term contracts. | Recurring subscription-based model |
| Key Modules | 1. Financial Management 2. Construction Management 3. CRM 4. Distribution Management 5. Service Management 6. Manufacturing Management 7. Project Accounting Management 8. Payroll 9. Retail e-Commerce Management 10. Reporting, Dashboard and BI | 1. Manufacturing 2. Supply Chain Management 3. Projects 4. Finance 5. Human Capital Management 6. Procurement 7. Customer Relationship Management 8. Commerce |

ERP System Scorecard Matrix
This resource provides a framework for quantifying the ERP selection process and how to make heterogeneous solutions comparable.
Acumatica vs IFS Feature Comparison
Both platforms offer a plethora of features and functionalities designed to streamline business operations and enhance efficiency. In this feature comparison, we delve into particularly the distinct capabilities of Acumatica vs IFS across various critical dimensions, providing insights to aid businesses in making informed decisions regarding their ERP selection. Thus, this section discusses features under each of the following modules, particularly financial management, supply chain management, and manufacturing management.
Financial Management Comparison
In this section, we are discussing a detailed comparison of the financial management capabilities particularly offered by Acumatica vs IFS. By examining their respective strengths and functionalities, particularly in managing financial processes. Businesses can therefore gain valuable insights to determine the best-suited ERP solution for their financial management needs.
| Acumatica | IFS | ||
| Financial Management | General Ledger | Designed to support ledgers limited to support one country. Limited multi-ledger capabilities. | Centralizes financial data management, enabling accounting, reporting, and analysis. |
| Accounts Receivable and Accounts Payable | The AR and AP might be limited to just one country with limited synergies among vendors from different countries. | Streamlines customer invoicing, payment processes, vendor invoices and payments. | |
| Cash Flow Management | Manages day-to-day transactions, cash balances, funds transfers, and bank account reconciliations for smaller operations. | Enables accurate planning and forecasting of cash activities, and analyze liquidity and cash positions. | |
| Currency Management | Creates estimates for new or existing items, convert to bills of material, production orders. | Handles transactions in multiple currencies, automatically calculating exchange rates and converting transactions into the base currency. | |
| Tax Management | Provides centralized tax configuration, management, and reporting. | Automates and manages tax calculations, compliance, and reporting across multiple jurisdictions. |

ERP Selection Requirements Template
This resource provides the template that you need to capture the requirements of different functional areas, processes, and teams.
Supply Chain Management Comparison
In this comparison, we explore and analyze the supply chain management capabilities of Acumatica vs IFS, shedding light particularly on their respective strengths and weaknesses.
| Acumatica | IFS | ||
| Supply Chain Management | Warehouse Management | Provides real-time inventory visibility and streamlines warehouse operations. | Enables businesses to efficiently manage warehouse operations by automating the physical storage and retrieval of inventory items. |
| Service Management | Enables quick service needs capture, assignment, and real-time tracking, with features like contract management and appointment schedules. | Enables organizations to efficiently manage their field service operations, including planning, scheduling, dispatching, and also mobile workforce management. | |
| Inventory Management | Simplifies inventory processes with flexible item management and quality traceability. | Provides real-time visibility into stock movements, allowing businesses to maintain optimal inventory levels by setting reorder points and also reducing the risk of overstocking and stock-outs. | |
| Purchase Order Management | Streamlines procurement processes with policy enforcement and process controls. | Streamlines the procurement process by automating the creation, tracking, and approval of purchase orders, ensuring efficient and accurate order fulfillment. | |
| Sales Order Management | Centrally manages sales activities and tracks prices and inventory. | Efficiently handles the entire sales order process from quotation to invoicing, ensuring accurate order fulfillment and also real-time tracking across multiple sites. | |
| Requisition Management | Organizes complex distribution processes involving multiple products and suppliers. | Simplifies the procurement process by allowing users to create, track, and approve requisitions, ensuring that all purchase requests are efficiently managed and fulfilled. |
Manufacturing Management Comparison
In this comparison, we explore and analyze the manufacturing management capabilities of Acumatica vs IFS, shedding light, particularly on their respective strengths and weaknesses.
| Acumatica | IFS | ||
| Manufacturing Management | Production Planning | Assists manufacturers in addressing production demand with the agility to adjust to fluctuating schedules, unforeseen equipment malfunctions, delayed deliveries from suppliers, and other unexpected occurrences affecting operations on the factory floor. | Optimizes manufacturing processes by providing tools for capacity planning, production scheduling, material requirements planning, and also shop floor control, ensuring real-time visibility and efficiency. |
| BOM and Routing | Lets you efficiently plan and manage inventories, costs and manufacturing processes. | Streamlines manufacturing by detailing the components and materials needed for production and also defining the sequence of operations required to produce a finished product. | |
| Advanced Planning and Scheduling | Lets you create a more streamlined and accurate production scheduled, better enforce delivery dates and optimize for capacity. | Enhances manufacturing efficiency by optimizing resource allocation, production schedules, and also material requirements through advanced algorithms and real-time data analysis. |

Pros of Acumatica vs IFS
When evaluating ERP solutions, understanding the distinct advantages of Acumatica vs IFS is crucial. In this section, we are particularly exploring the strengths of Acumatica vs IFS across various dimensions. Thus, shedding light on their respective capabilities and functionalities.
| Acumatica | IFS |
| Great 1st or 2nd ERP choice particularly due to limited layers and mature capabilities for larger companies. | One of the most consistent user experiences that have been rearchitected and modernized. |
| Accommodates different business models spread in fewer countries under one database. | One of the strongest asset-management capabilities particularly for organizations with very thick asset and predictive maintenance needs. |
| Great fit for SMB B2B businesses with complex product mixes. | Designed to particularly handle large programs where consolidated visibility would be critical without ad-hoc arrangements. |
| Born in the cloud with consistent design principles across the application. | Unique financial workflows to support complex project manufacturing programs. |
Cons of Acumatica vs IFS
Just like recognizing strengths is important, it’s also crucial to weigh the specific drawbacks of Acumatica vs IFS. Therefore, in this section, we will delve into the limitations and challenges associated with Acumatica vs IFS across various operational and financial dimensions.
| Acumatica | IFS |
| Limited capabilities when multiple countries with different currencies and sub-ledgers need to be hosted as part of the same solution. | Has a limited presence in North America and also a lean partner ecosystem. |
| Not fit for companies with over $100 million in revenue. | Companies with a diverse business model, might outgrow or struggle with the solution. |
| The mobile capabilities are leaner for complex reporting scenarios such as parallel processing or reporting labor. | Companies involved with the M&A or the ones part of the PE portfolio might not be the best fit for IFS. |
| Consumption-based pricing requires consulting expertise to estimate transactions as the pricing is not as predictable. | IFS might not be the best fit to be used just as the corporate ledger for large project manufacturing enterprises. |
Conclusion
In conclusion, Acumatica vs IFS cater to distinct business needs, making the choice between the two dependent on an organization’s size, complexity, and industry focus. Acumatica, with its multi-branch and business model capabilities, is an excellent fit for small to mid-sized businesses in the $10-$100 million revenue range, particularly those looking for an entry-level ERP solution with a cloud-native experience. It offers a flexible and versatile system, particularly ideal for companies needing basic operational features without the burden of complex multi-entity or global capabilities. However, it may fall short for businesses requiring advanced global features and extensive asset management capabilities.
On the other hand, IFS is positioned for upper mid-market companies, particularly those with more complex operational needs in asset-centric industries such as energy, construction, and IT field services. Its robust multi-entity capabilities, combined with strong asset and field service management features, thus makes it a compelling choice for companies nearing or exceeding $1 billion in revenue. While IFS provides mature, industry-specific functionality, it demands a higher level of expertise for implementation and is best suited for enterprises looking for a sophisticated ERP solution with global reach and deep operational capabilities.
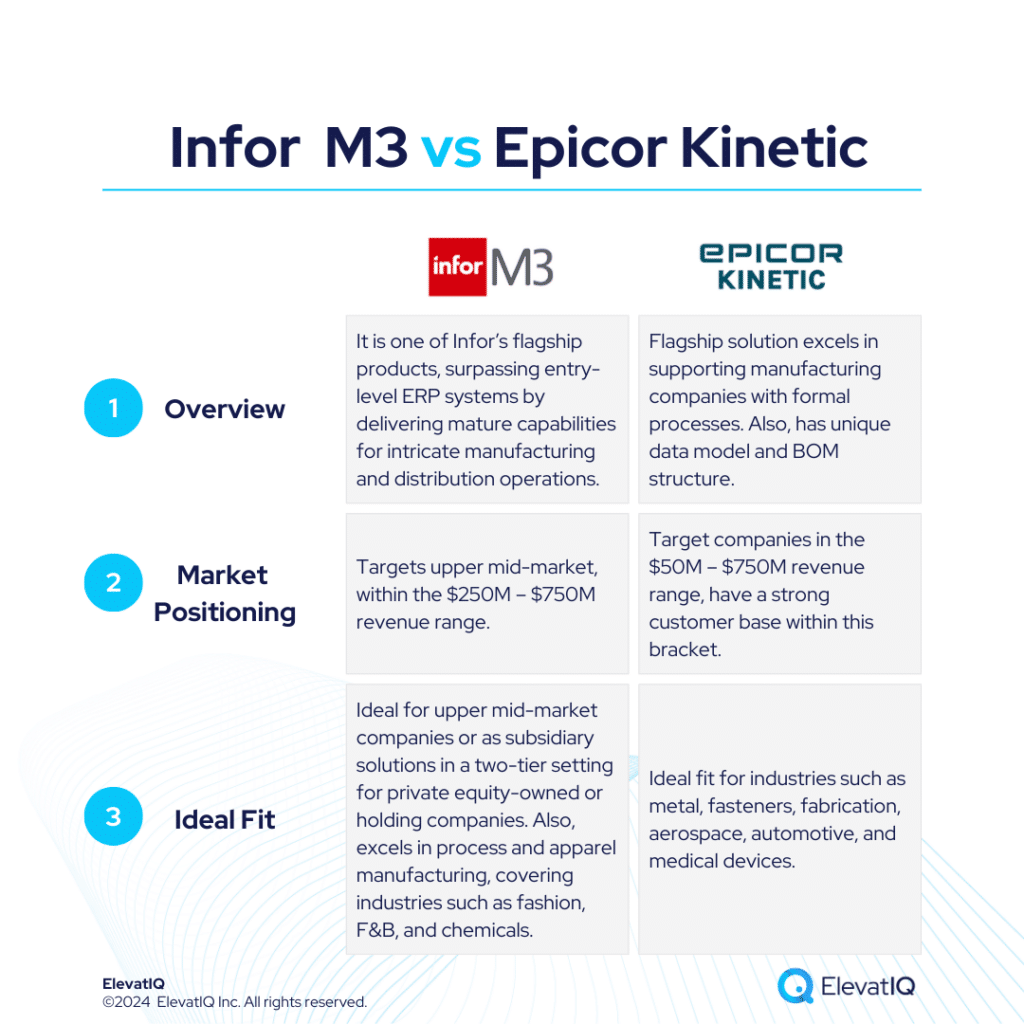
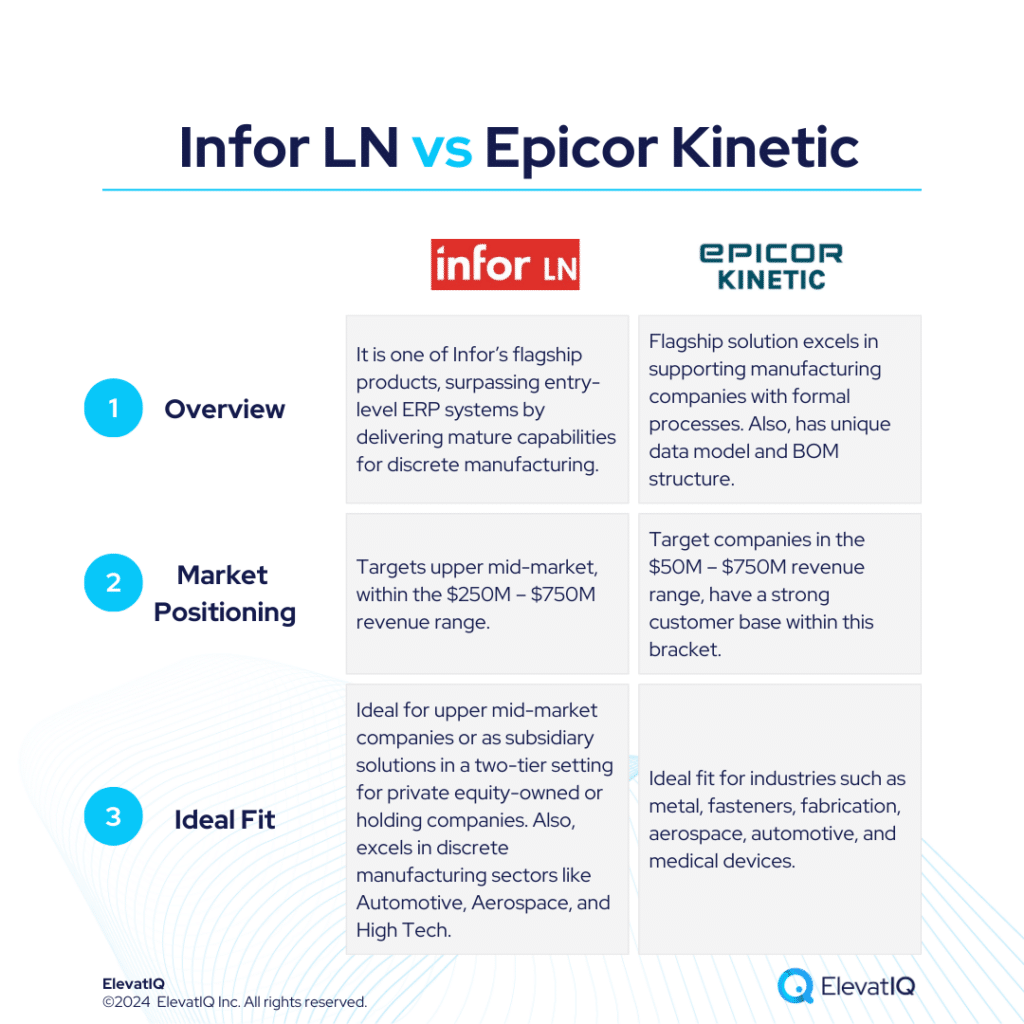
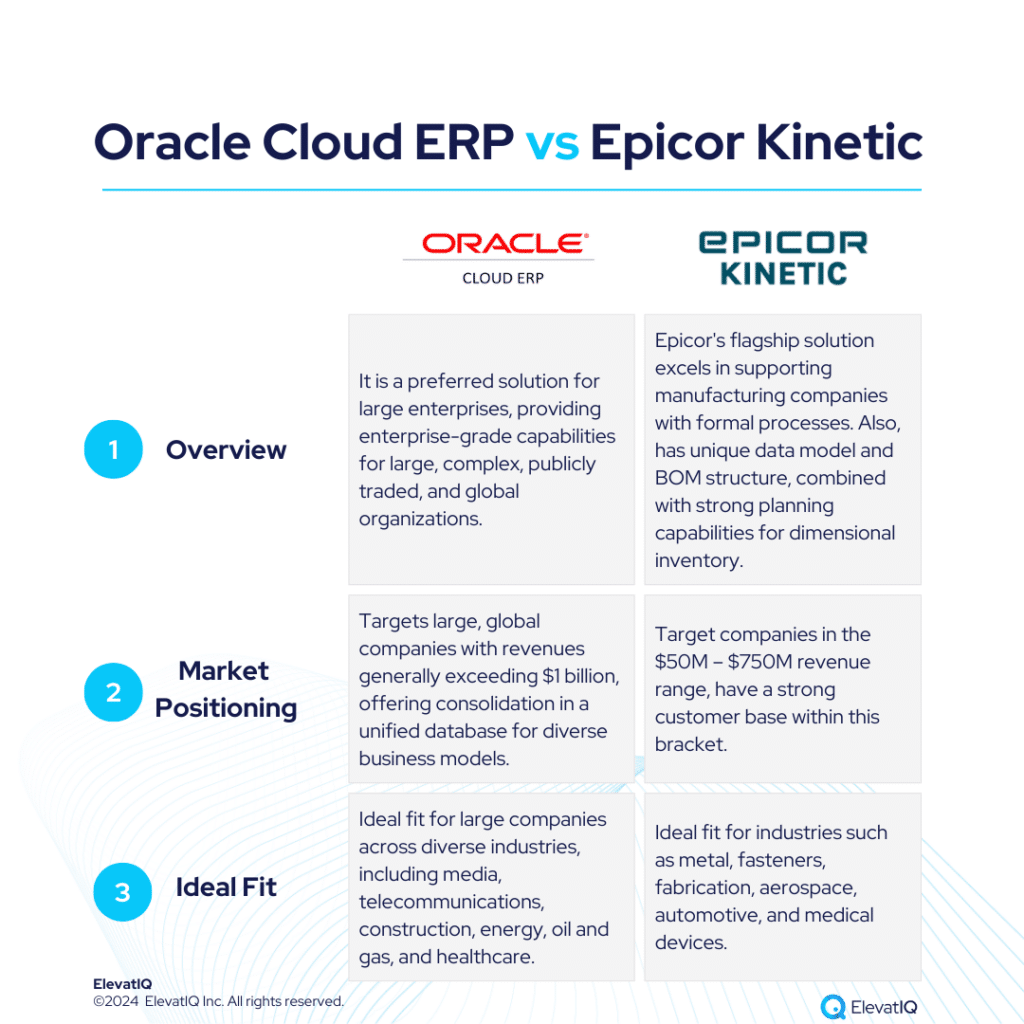
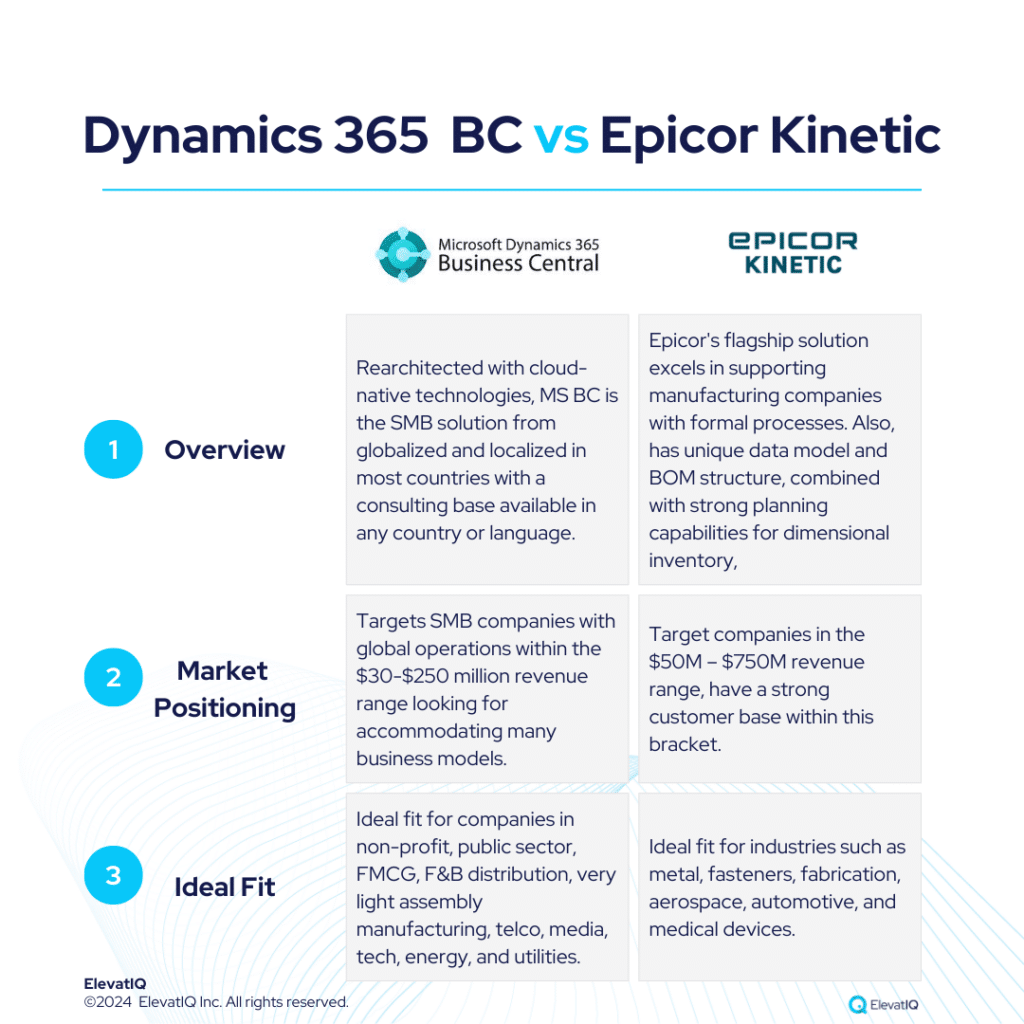
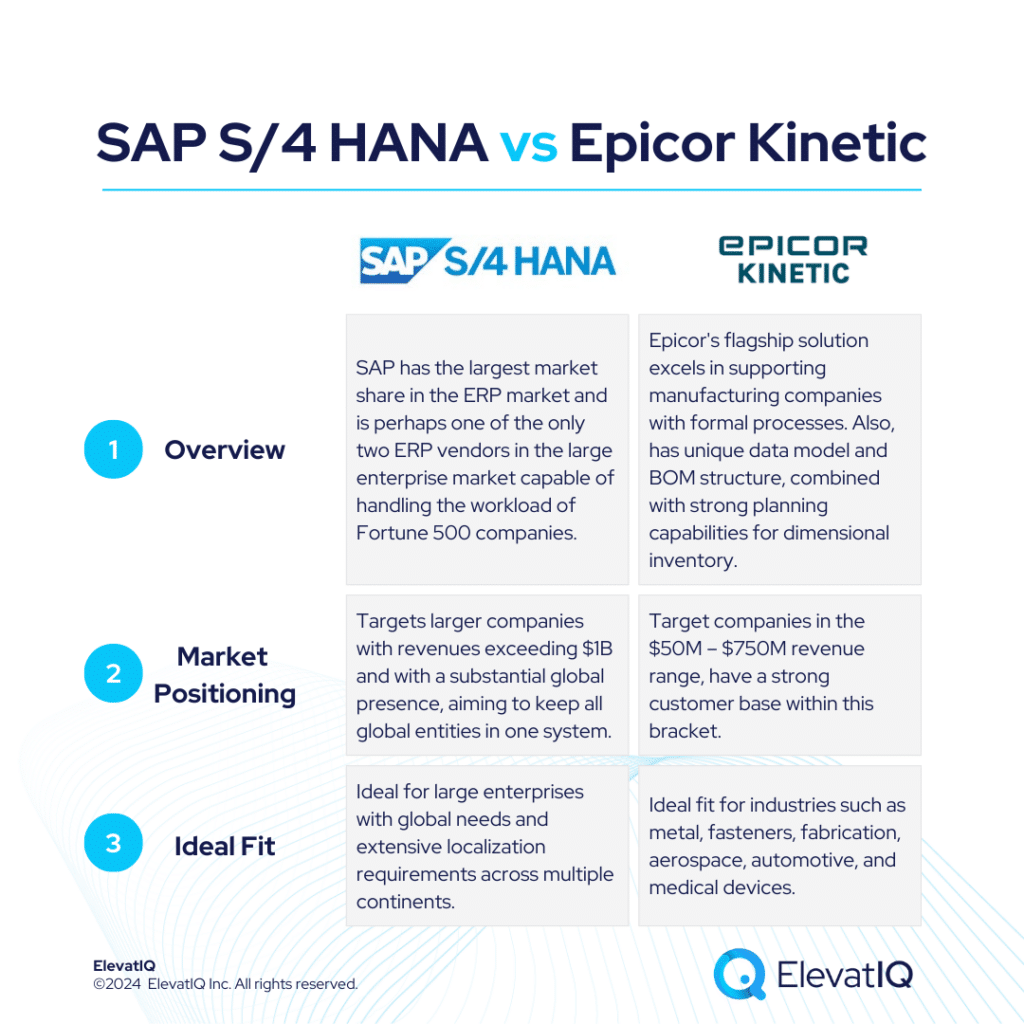
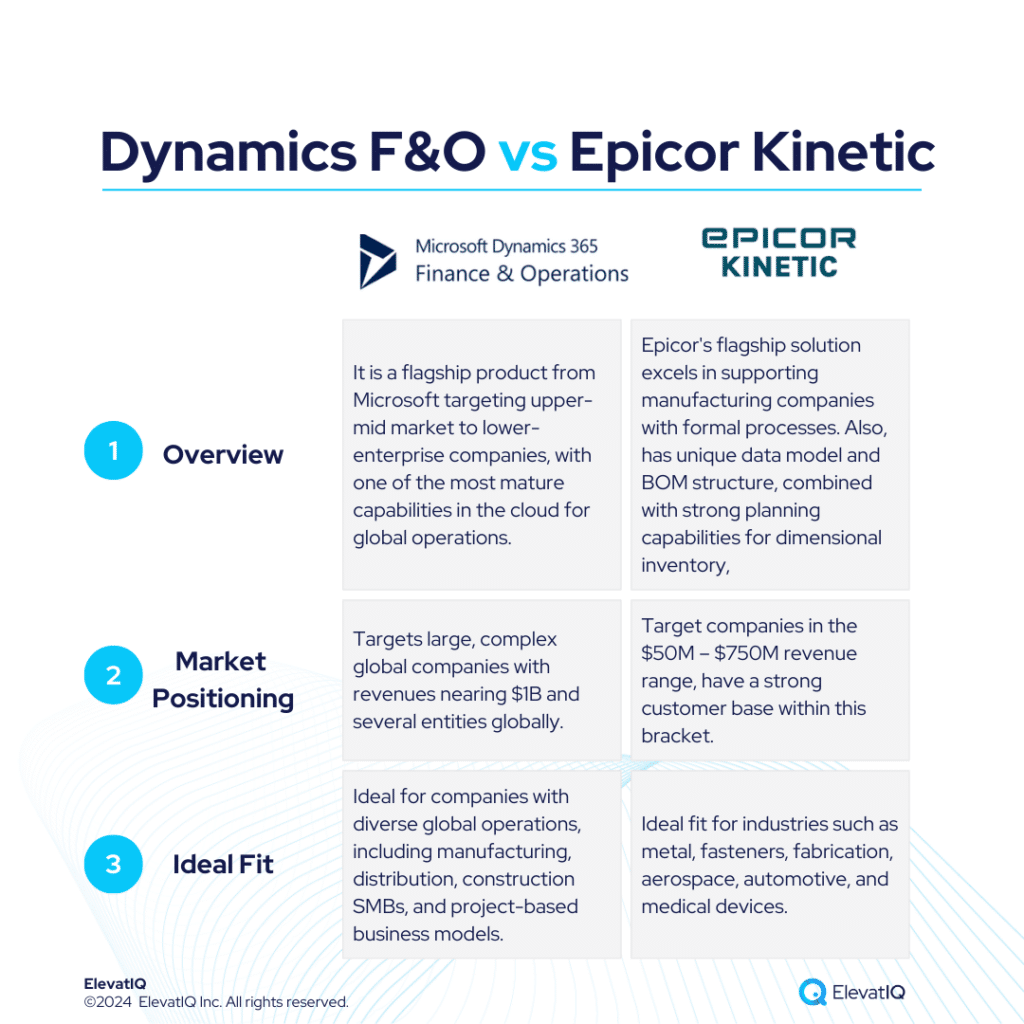
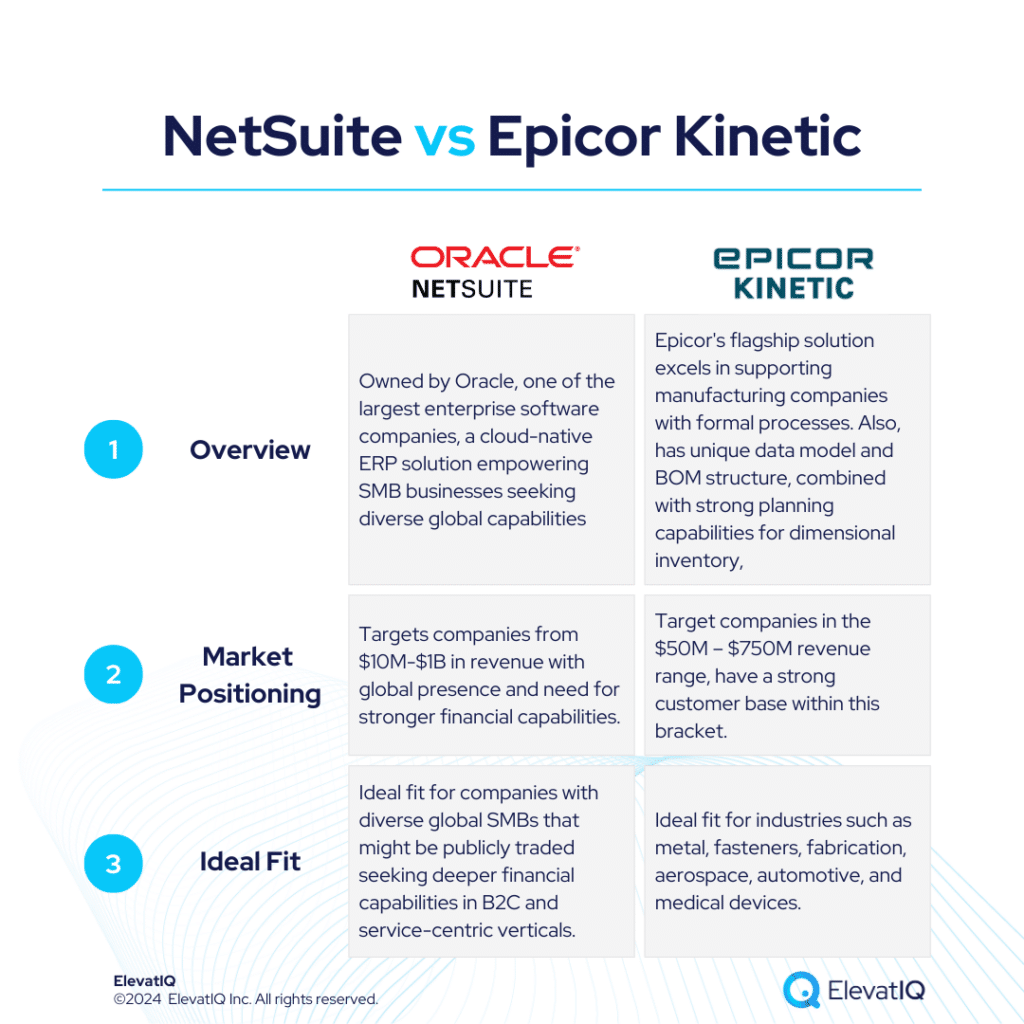
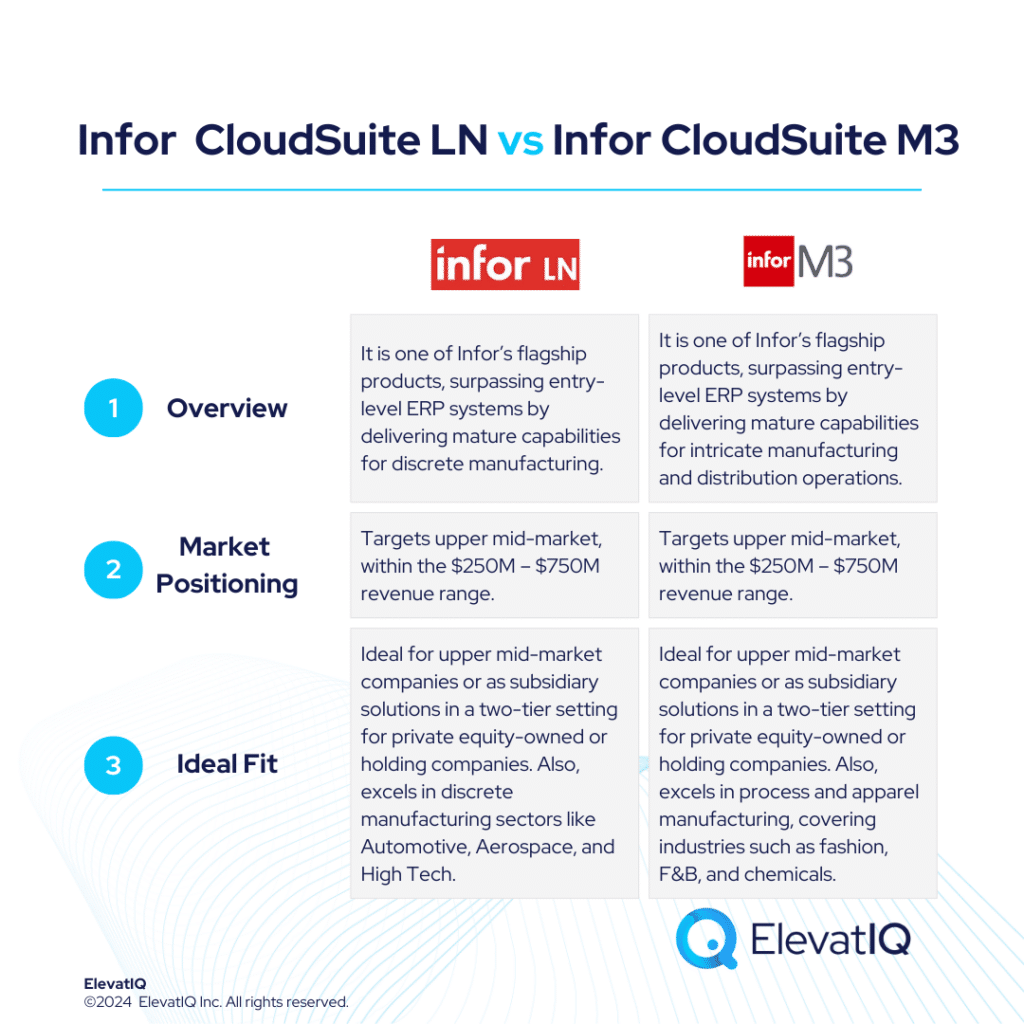
Both systems have their strengths and limitations, so businesses should carefully evaluate their specific need. Also, seeking assistance from an independent ERP consultant can significantly aid the decision-making process. To get a 360-degree view of feature comparisons, it’s essential to explore not only Acumatica vs. IFS but also insights from other analyses such as Acumatica vs. NetSuite, SAP S/4 HANA, Oracle Cloud ERP, Dynamics F&O, Dynamics 365 BC, Infor LN, Infor M3, and Epicor Kinetic.

ERP Selection: The Ultimate Guide
This is an in-depth guide with over 80 pages and covers every topic as it pertains to ERP selection in sufficient detail to help you make an informed decision.
FAQs
Acumatica vs IFS ERP Independent Review Read More »