ServiceNow: Acquires Moveworks To Strengthen AI Capabilities
ServiceNow has made a bold move in the AI-driven enterprise automation space with its latest acquisition of Moveworks for $2.85 billion. This deal, a mix of cash and stock, is the largest in ServiceNow’s history. It signals the intent to expand deeper into AI and CRM. Moveworks, known for its AI-powered enterprise assistant technology, brings strong capabilities in automation and enterprise search. Thus, making it a valuable addition to ServiceNow’s ecosystem.
With AI rapidly shaping the future of business operations, this acquisition is expected to enhance ServiceNow’s offerings. Also, helping enterprises streamline workflows and improve digital employee experiences. Let’s take a closer look at what this means for the industry, customers, and ServiceNow’s long-term growth strategy.
The Breakdown Of The ServiceNow Moveworks Acquisition
In the breakdown of the ServiceNow Moveworks acquisition, we will explore the key elements of this $2.85 billion deal. This includes its financial structure and expected timeline for completion. We will examine how Moveworks’ AI-powered enterprise assistant enhances ServiceNow’s automation and workflow solutions. Thus, strengthening its position in the enterprise software market. Lastly, we will also discuss why ServiceNow is prioritizing AI and CRM investments.
The Financials and Deal Structure
Valued at $2.85 billion, the ServiceNow Moveworks acquisition will be finalized through a combination of cash and stock. The deal is expected to close in the second half of 2025, pending regulatory approvals and other standard conditions. This acquisition marks a significant milestone for ServiceNow. Thus, intensifies its AI investments to stay ahead in an increasingly competitive market.

What Moveworks Brings to the Table
Moveworks has built a strong reputation in the AI space with its conversational enterprise assistant. Also, it integrates seamlessly into business applications. The platform allows employees to get instant support, automate routine tasks, and access company-wide information effortlessly. It has more than 350 enterprise clients, including Siemens, Unilever, Toyota, and Instacart. Hence, Moveworks has established itself as a leader in AI-powered automation.
Through the ServiceNow Moveworks acquisition, ServiceNow gains access to this cutting-edge AI technology. It also gains access to a team of 500 AI experts who will be joining its ranks. This move strengthens ServiceNow’s AI capabilities and accelerates its goal of delivering autonomous AI-driven business solutions.
Why ServiceNow is Investing in AI and CRM
The ServiceNow Moveworks acquisition is part of a broader trend where companies are integrating AI into their operations to drive efficiency. By incorporating Moveworks’ AI assistant, ServiceNow aims to enhance its CRM capabilities, providing customers with a more seamless “sell, fulfil, and service” experience.
More importantly, this acquisition aligns with ServiceNow’s long-term vision of AI-powered automation, particularly in the growing area of agentic AI – AI systems that can autonomously complete business processes with minimal human intervention. This development could redefine how enterprises handle customer service, HR, IT support, and other critical functions.


The 2026 Digital Transformation Report
Thinking of embarking on a ERP journey and looking for a digital transformation report? Want to learn the best practices of digital transformation? Then, you have come to the right place.
Analyst’s Take On The ServiceNow Moveworks Acquisition
How This Acquisition Fits Into Industry Trends
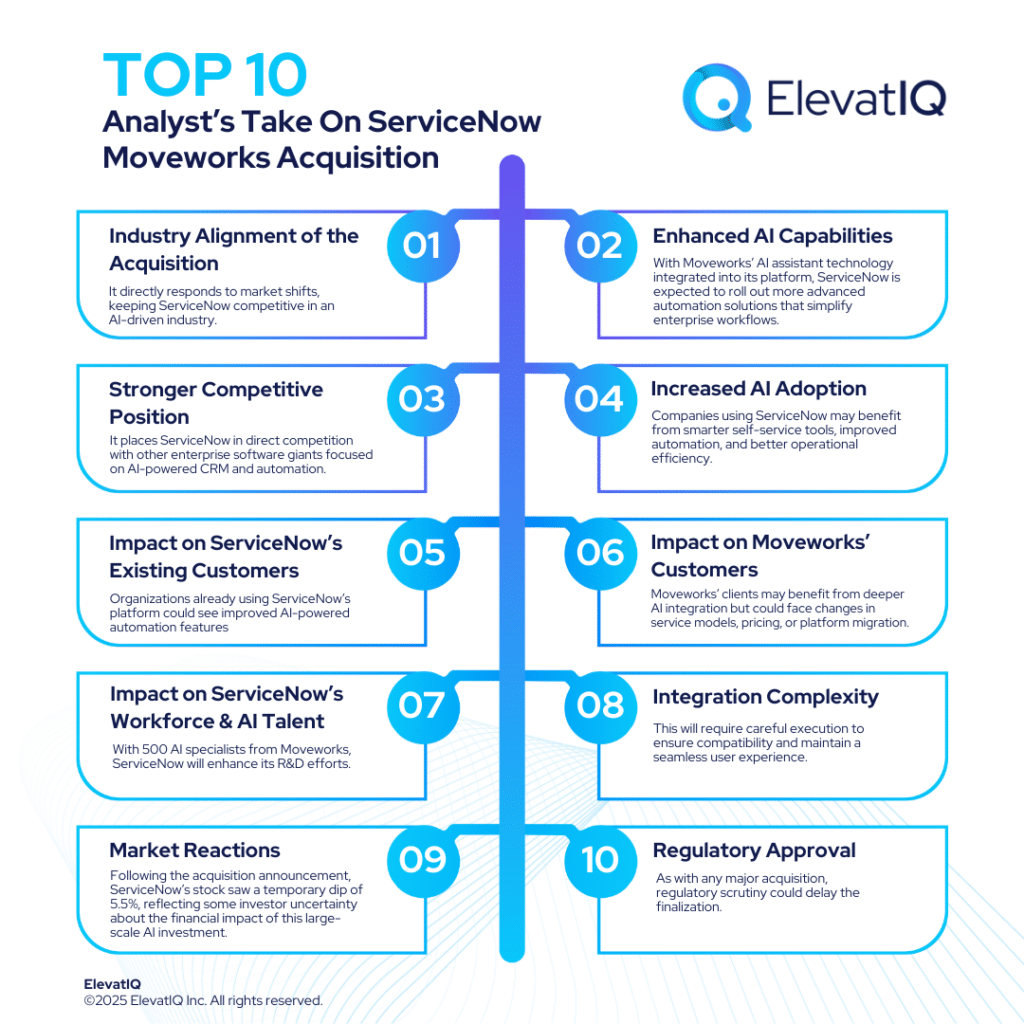
The AI-driven automation space has seen significant consolidation recently, with major players like Microsoft, Salesforce, and Oracle making aggressive AI investments. The ServiceNow Moveworks acquisition is a direct response to these market shifts, ensuring that ServiceNow remains competitive in an industry increasingly dominated by AI-driven solutions.
What Lies Ahead for ServiceNow and Its Customers
- Enhanced AI Capabilities: With Moveworks’ AI assistant technology integrated into its platform, ServiceNow is expected to roll out more advanced automation solutions that simplify enterprise workflows.
- Stronger Competitive Position: The ServiceNow Moveworks acquisition places ServiceNow in direct competition with other enterprise software giants focused on AI-powered CRM and automation.
- Increased AI Adoption Among Businesses: As AI becomes more embedded in enterprise systems, companies using ServiceNow may benefit from smarter self-service tools, improved automation, and better operational efficiency.
Potential Impact on Stakeholders
- ServiceNow’s Existing Customers: Organizations already using ServiceNow’s platform could see improved AI-powered automation features, particularly in service management and workflow optimization.
- Moveworks’ Customers: While Moveworks’ existing clients stand to gain from deeper AI integration within the ServiceNow platform, they may also face changes in service models, pricing structures, or platform migration requirements.
- ServiceNow’s Workforce and AI Talent Pool: With 500 AI specialists joining ServiceNow from Moveworks, the company is expected to strengthen its research and development efforts, fueling future AI advancements.
Challenges and Considerations
While the ServiceNow Moveworks acquisition presents significant opportunities, there are a few hurdles to consider:
- Integration Complexity: Bringing Moveworks’ AI assistant into ServiceNow’s existing ecosystem will require careful execution to ensure compatibility and maintain a seamless user experience.
- Market Reactions: Following the acquisition announcement, ServiceNow’s stock saw a temporary dip of 5.5%, reflecting some investor uncertainty about the financial impact of this large-scale AI investment.
- Regulatory Approval: As with any major acquisition, regulatory scrutiny could delay the finalization of the deal or introduce unforeseen compliance challenges.

FAQs
ServiceNow: Acquires Moveworks To Strengthen AI Capabilities Read More »