SAP S/4 HANA vs Infor LN ERP Independent Review
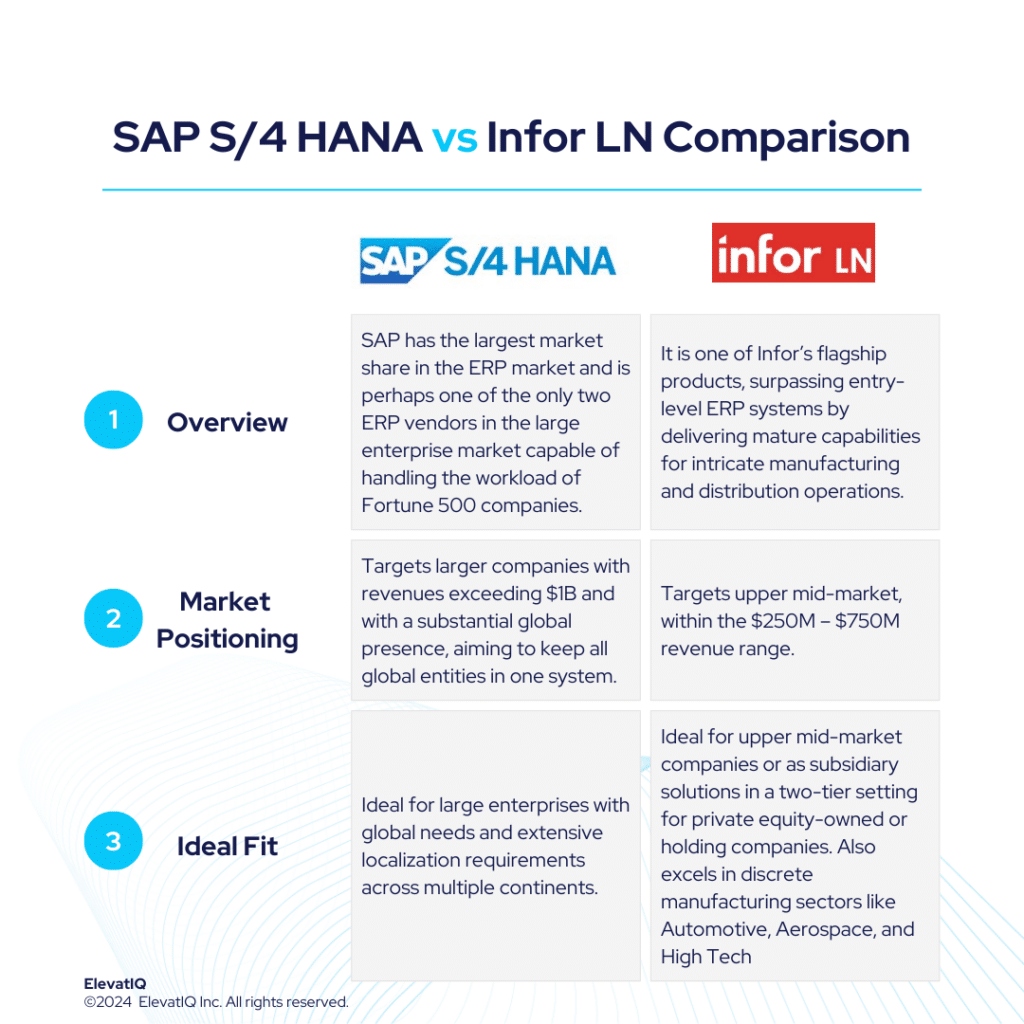
SAP maintains its dominance in the ERP market, largely due to its stronghold in the enterprise segment where deals are significantly larger compared to the mid-market. The architecture complementing the S/4 HANA Suite is particularly favored by enterprise-grade companies, offering leading products like SuccessFactors, Hybris, EWM, Ariba, and Concur. On the other hand, Infor CloudSuite LN surpasses entry-level ERP systems like Acumatica, Infor CSI, or NetSuite, by delivering mature capabilities for intricate manufacturing intertwined with distribution operations.
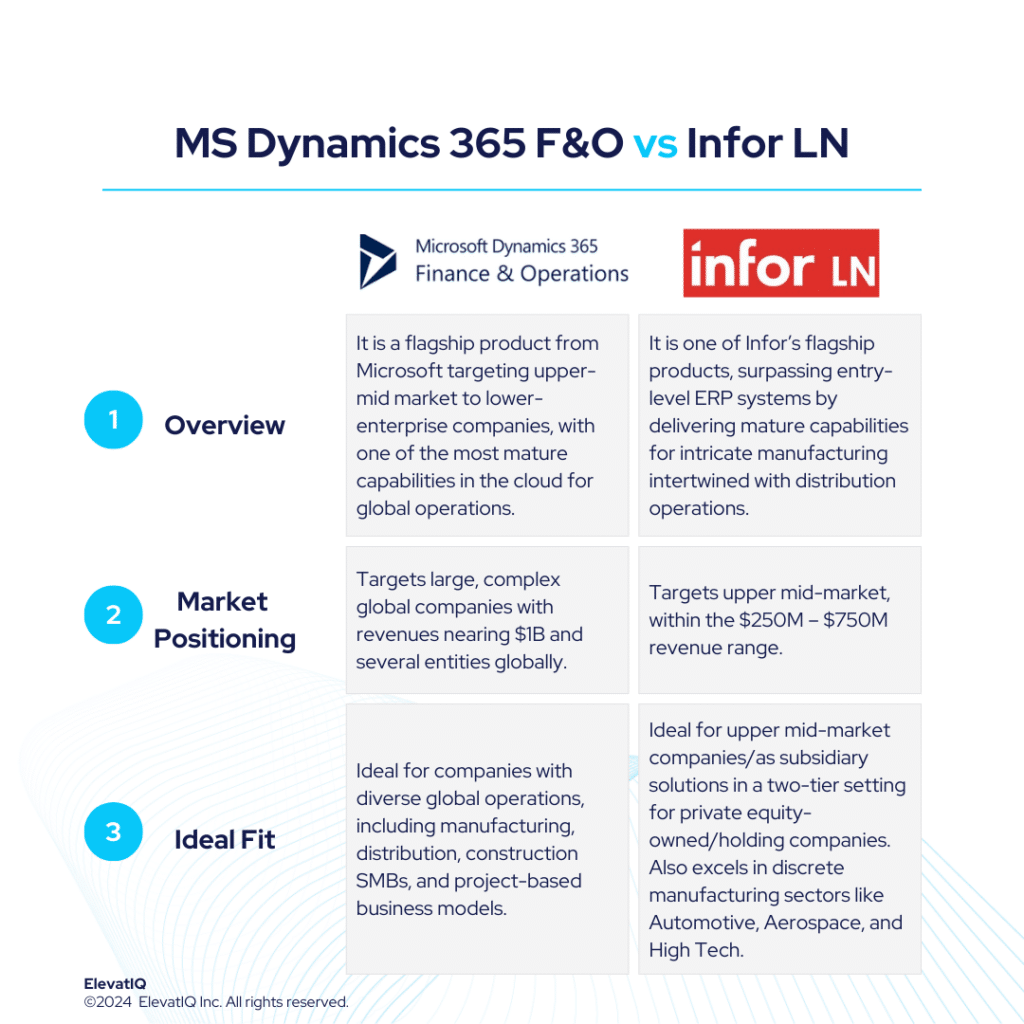
SAP S/4 HANA targets larger companies with revenues exceeding $1B and with a substantial global presence, aiming to keep all global entities in one system. Whereas, Infor LN is a successful upper mid-market player, targeting the $250M – $750M revenue range. SAP S/4 HANA often becomes a default choice for enterprise companies due to high transaction volumes, stringent governance, and traceability needs. It particularly shines in product-centric enterprises requiring robust capabilities like MRP and allocation for global workloads. On the other hand, compared to SAP, Infor LN provides a similar suite experience, featuring enterprise-grade best-of-breed functionalities, including PLM, WMS, WFM, BI, and a supply chain collaboration platform.
Choosing between SAP S/4 HANA vs Infor LN requires a detailed examination, and thus, this comparison offers valuable insights for ERP selection projects. Therefore, let’s explore further.
| SAP S/4 HANA | Infor CloudSuite LN | |
| Started in | Pioneers of ERP | 2006 (when Infor acquired BaaN) |
| Ownership by | SAP | Koch Industries |
| No. of customers | 28000+ | 1000+ |


The 2026 Digital Transformation Report
Thinking of embarking on a ERP journey and looking for a digital transformation report? Want to learn the best practices of digital transformation? Then, you have come to the right place.
What is SAP S/4 HANA?
SAP S/4 HANA remains the top choice for large enterprises with global needs and extensive localization requirements across multiple continents. In this league, its primary rival is Oracle. While alternatives like Unit4, IFS, or Deltek might handle the workload for larger enterprises, they often lack the robust global compliance and transactional capabilities that SAP S/4 HANA offers. Additionally, SAP S/4 HANA excels in providing superior transactional workflow capabilities that are purpose-built to streamline traceability for large and complex organizations.
Moreover, SAP S/4 HANA is an ideal choice for companies seeking a best-of-breed architecture tailored to the needs of specific functions. This architecture allows for operational cores on different ledgers, which is particularly crucial for larger distribution and 3PL companies managing complex WMS networks. Companies with intricate HCM operations and stringent compliance requirements may find it necessary to integrate a best-of-breed system.
Additionally, for enterprises requiring sophisticated eCommerce platforms with components like CDP or CPQ, SAP S/4 HANA provides the essential capabilities. The flexibility and enterprise-grade best-of-breed architecture make SAP S/4 HANA a standout solution for such diverse operational needs. The cloud version may require additional third-party add-ons, similar to NetSuite. Nevertheless, organizations opting for the on-prem version can access superior capabilities, potentially outperforming other ERP systems.
What Is Infor CloudSuite LN?
Infor CloudSuite LN is a complete product suite to meet the needs of an enterprise particularly similar to Epicor, SAP, Oracle, or Microsoft. Infor is also perhaps the only vendor after the larger ones that has the capabilities to build best-of-breed architecture akin to SAP, Oracle, and Microsoft. In fact, Infor might have deeper capabilities than Microsoft in some areas with pre-integrated best-of-breed solutions such as Infor WFM and Nexus. Infor is also the only vendor that can provide depth in several industries while not struggling with the transactional processing requirements of large accounts.
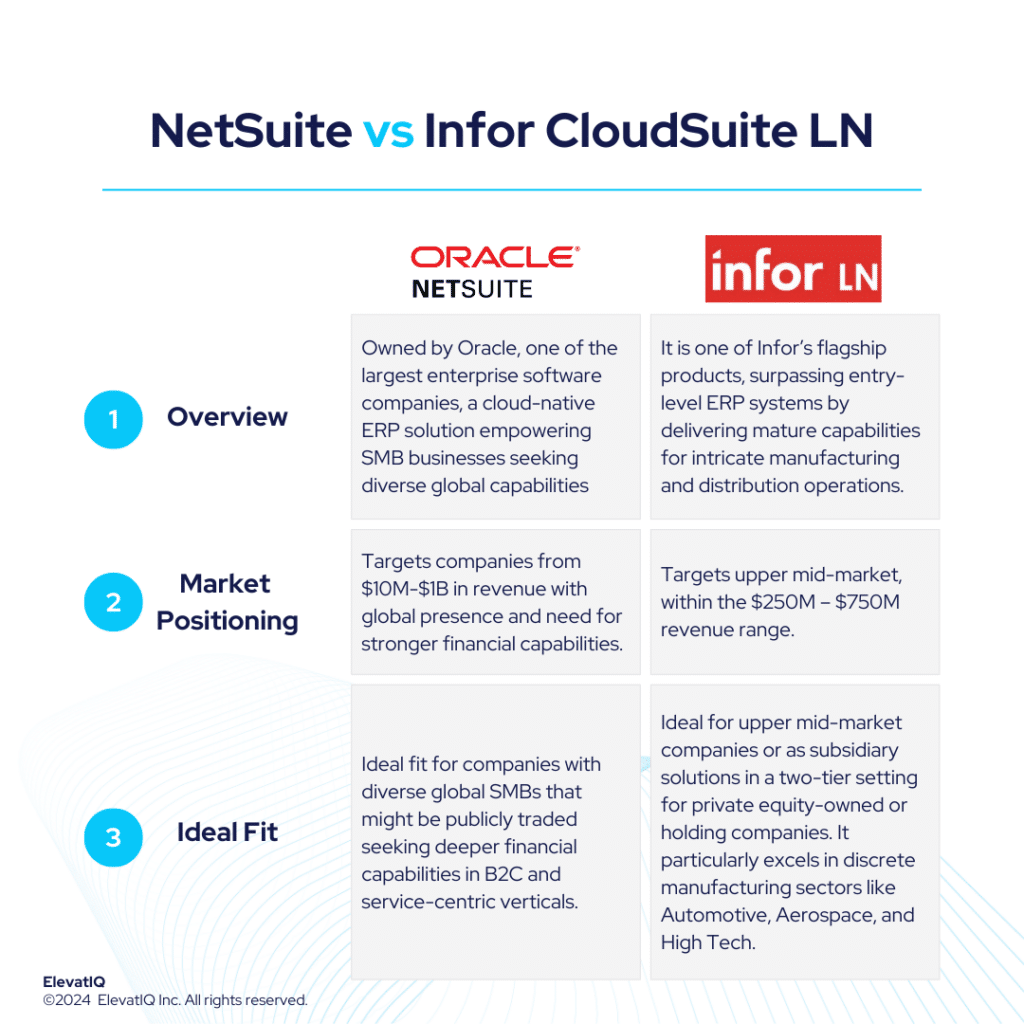
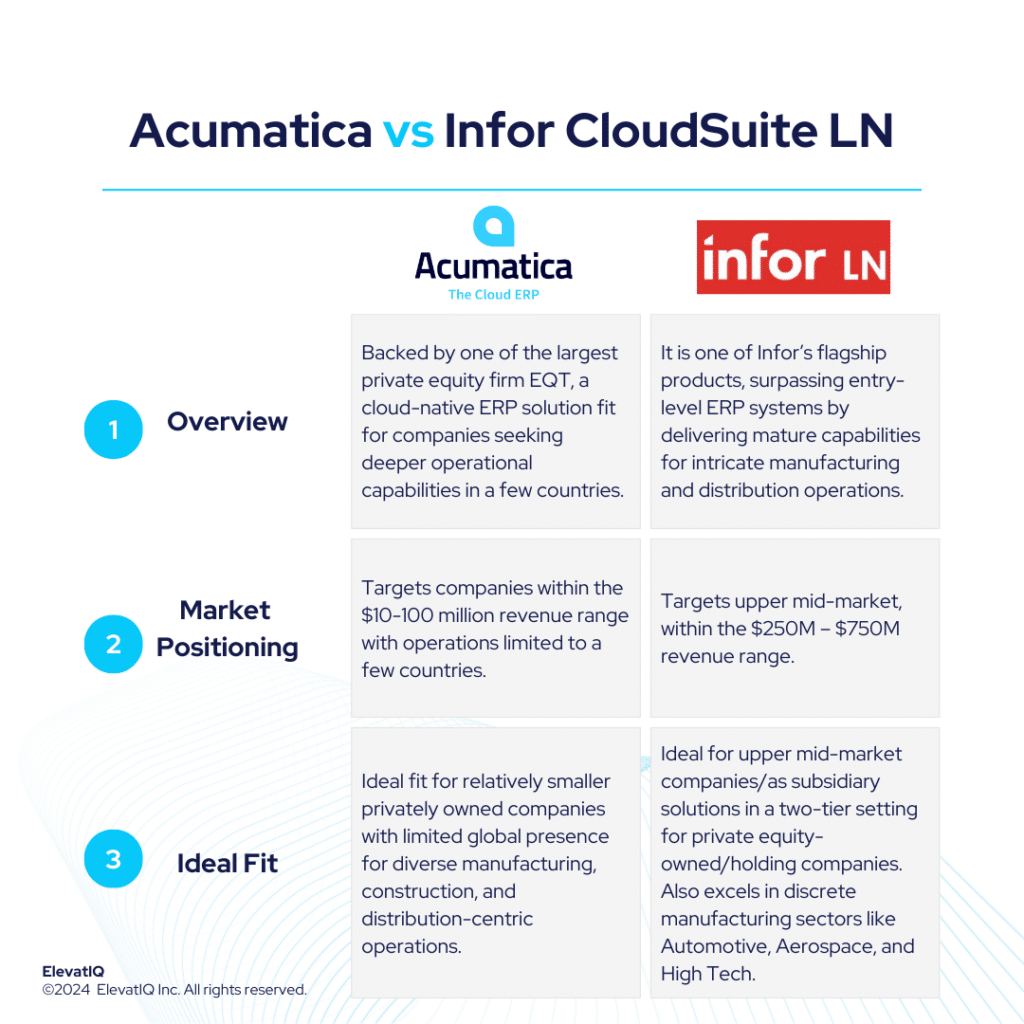
Infor LN is particularly ideal for discrete manufacturing companies. It is successful in the upper mid-market, targeting the $250M – $750M revenue range. Positioned for companies surpassing entry-level ERP systems like Acumatica, Infor CSI, or NetSuite, this solution delivers mature capabilities particularly for intricate manufacturing intertwined with distribution operations. Infor LN also provides a superior suite experience akin to SAP and Oracle, featuring enterprise-grade best-of-breed functionalities, including PLM, WMS, WFM, BI, and a supply chain collaboration platform.
While Infor LN excels in discrete manufacturing and offers a robust suite experience, it does face certain challenges in specific scenarios such as with process-centric operations for companies. They might also include business operations such as plastic or chemicals as part of their automotive operations. Despite limitations in broader capabilities compared to other vanilla solutions, recent upgrades acknowledge its broader application in various automotive business models.
SAP S/4 HANA vs Infor LN Comparison
Navigating the choice between SAP S/4 HANA vs Infor LN is a significant decision for businesses particularly looking for operational efficiency and strategic alignment. Thus, this section delves into the comprehensive comparison of SAP S/4 HANA vs Infor LN across various critical dimensions.
| SAP S/4 HANA | Infor CloudSuite LN | |
| Global Operational Capabilities | Deeper multi-entity capabilities; widely installed globally. | Has sufficient layers of financial hierarchies and global trade compliance functionality pre-baked with products. |
| Diverse Capabilities | Handles diverse business models; may require add-ons for deeper capabilities. | Limited focus on certain business models. |
| Best-of-breed Capabilities | Pre-integrated enterprise apps; augmented by third-party add-ons. | HCM, PLM, data lake, ERP, WMS, TMS, and advanced supply chain planning, are all pre-integrated with LN. |
| Last-mile Capabilities | Limited last-mile capabilities; may also need add-ons for micro-verticals. | Last-mile capabilities along with breadth of capabilities for diversified manufacturing business models. |
| Operational Functionalities | Enterprise-grade operational capabilities; industry-specific features limited. | Infor LN is a legacy solution with limited cloud-native capabilities such as universal search, mobile experience, etc. |
| Integration Capabilities | Has several tools pre-integrated as part of the architecture but industry-specific integrations such as CAD, PLM, etc require third-party add-ons. | Most tools that a manufacturer would require, such as HCM, PLM, data lake, ERP, WMS, TMS, and advanced supply chain planning, are all pre-integrated with LN. |
| Manufacturing Capabilities | Complex capabilities; industry-specific limitations. | This solution delivers mature capabilities for intricate manufacturing and also distribution operations. |
| Pricing Model | FUE (Full Use Equivalent) | Subscription-based |
| Key Modules | 1. Financial Management 2. Sales 3. Procurement 4. Manufacturing Management 5. Supply Chain Management 6. Professional Services Automation 7. CRM | 1. Financials 2. Human Resources 3. Manufacturing Management 4. Inventory Management 5. Purchasing Management 6. Quality Management 7. Sales Management 8. Product Technology |
SAP S/4 HANA vs Infor LN Feature Comparison
Both platforms offer a plethora of features and functionalities designed to streamline business operations and enhance efficiency. In this feature comparison, we delve into particularly the distinct capabilities of SAP S/4 HANA vs Infor LN across various critical dimensions, providing insights to aid businesses in making informed decisions regarding their ERP selection. Thus, this section discusses features under each of the following modules, particularly financial management, supply chain management, and manufacturing management.
Financial Management Comparison
In this section, we are discussing a detailed comparison of the financial management capabilities particularly offered by SAP S/4 HANA vs Infor LN. By examining their respective strengths and functionalities, particularly in managing financial processes. Businesses can therefore gain valuable insights to determine the best-suited ERP solution for their financial management needs.
| SAP S/4 HANA | Infor CloudSuite LN | ||
| Financial Management | General Ledger | Can support the needs of even the most complex financial organizations with more than ten ledger rollups at the country level and conversions. | The General Ledger is the core component of Infor LN Financials, recording all transactions within the application that affect accounting. |
| Accounts Receivable and Accounts Payable | Supports global collaboration of customers and vendors, including shared service model. | AR manages customer invoices and credit, while AP handles supplier invoices and also balance management. | |
| Cash Flow Management | Complex treasury capabilities with support for global operations, including maintaining treasury KPIs, workflows, and processes for dedicated treasury departments. | Provides comprehensive forecasting, analysis, and Azure ML-based prediction of cash inflows and outflows. | |
| Currency Management | Can support complex currency workflows such as hedging and planning for current impact on different financial statements and accounts globally. | The LN multicurrency systems allow a company to conduct accounting in multiple currencies, calculating and registering amounts in up to three currencies. | |
| Tax Management | Has built-in support for taxes in over 100 countries. | Tax reporting is part of financial accounting and is limited to one country, so LN’s tax handling in a multicompany structure is similar to that in a single company environment. |

ERP System Scorecard Matrix
This resource provides a framework for quantifying the ERP selection process and how to make heterogeneous solutions comparable.
Supply Chain Management Comparison
In this comparison, we explore and analyze the supply chain management capabilities of SAP S/4 HANA vs Infor LN, shedding light particularly on their respective strengths and weaknesses.
| SAP S/4 HANA | Infor CloudSuite LN | ||
| Supply Chain Management | Warehouse Management | Can support embedded or standalone architectural patterns along with complex business models such as 3PL or warehouse value-added services for third-party logistics. | Warehousing focuses on managing and replenishing goods within a warehouse, including tasks to report and analyze inventory movements. |
| Service Management | Can support complex quotes and service scheduling workflows of globally operated companies with large crews of field workers with scheduling dependencies of global operations. | Manages the maintenance, repair, and overhaul of field-based and plant-based products, equipment, and systems. | |
| Inventory Management | Robust inventory management capabilities accommodating many different business models and inventory types of complex, global organizations. | Can support complex inventory types including dedicated inventory masters for MRO or quality components for added granularity and control | |
| Purchase Order Management | Complex purchase order management workflows with automated approval rules, multiple layers of hierarchies of global organizations with procurement processes integrated with project management, and MRP engines. | Can create and modify purchase orders for purchasing goods. | |
| Requisition Management | Ability to manage complex requisition management processes of globally complex enterprises. | Specifies nonsystem planned requirements for different types of items, including inventory items, cost items, and service items. |

ERP Selection Requirements Template
This resource provides the template that you need to capture the requirements of different functional areas, processes, and teams.
Manufacturing Management Comparison
In this comparison, we explore and analyze the manufacturing management capabilities of SAP S/4 HANA vs Infor LN shedding light, particularly on their respective strengths and weaknesses.
| SAP S/4 HANA | Infor CloudSuite LN | ||
| Manufacturing Management | Production Planning | One of the most complex planning capabilities with enterprise-grade strategies to optimize production cycles for global companies. | One of the most robust production planning capabilities including advanced planning and scheduling capabilities for diverse manufacturing operations |
| BOM and Routing | Enterprise-grade BOM scalability for a variety of business models and products. | It is stored as general item data for LN in Item Production Data (IPD). | |
| Advanced Planning and Scheduling | Enterprise-grade advanced APS capabilities for complex globally distributed planning workloads that need to be collaborated across geographies. | Stores scheduling information for projects, allowing you to define project plans along with associated activities and milestones. |
Pros of SAP S/4 HANA vs Infor LN
When evaluating ERP solutions, understanding the distinct advantages of SAP S/4 HANA vs Infor LN is crucial. In this section, we are particularly exploring the strengths of SAP S/4 HANA vs Infor LN across various dimensions. Thus, shedding light on their respective capabilities and functionalities.
| SAP S/4 HANA | Infor CloudSuite LN |
| It is an ideal solution as the corporate financial ledger for global companies with multiple layers of financial hierarchies operating in multiple countries. | Ideal for upper mid-market companies or as subsidiary solutions in a two-tier setting for private equity-owned or holding companies. |
| The item master, product model, and warehouse architecture can accommodate the needs of most manufacturing business models. | It can support the most complex manufacturing business models, WBS-centric manufacturing, or support for attributes with MRP planning. |
| Because of the power of HANA, SAP S/4 HANA can process very complex MRP runs with product models containing millions of serial numbers and SKUs, making it much faster than most ERP systems. | Most tools that make-to manufacturer would require, such as HCM, PLM, data lake, ERP, WMS, TMS, and advanced supply chain planning, are all pre-integrated with LN. |
| Ideal fit for complex operations with its transactional maps capabilities built with the products, making debugging complex financial enterprises easier. | While most smaller solutions might require ad-hoc arrangements for global financial operations, Infor CloudSuite LN has them natively built. |
Cons of SAP S/4 HANA vs Infor LN
Just like recognizing strengths is important, it’s also crucial to weigh the specific drawbacks of SAP S/4 HANA vs Infor LN. Therefore, in this section, we will delve into the limitations and challenges associated with SAP S/4 HANA vs Infor LN across various operational and financial dimensions.
| SAP S/4 HANA | Infor CloudSuite LN |
| The controls provided as part of the product may feel unnecessary and overwhelming for smaller companies. | The limited focus on certain business models poses the risk of requiring other ERP systems to support complex and diverse business operations such as process manufacturing or metal-centric A&D companies. |
| Overbloated financial control processes, such as compliance, allocation, and approval flows, are only necessary for large organizations. | Private equity and holding companies requiring global solutions with a tier-2 solution at the subsidiary level might not be the best use of Infor LN’s strengths. |
| The data model is overwhelming for smaller organizations outgrowing QuickBooks or smaller ERP systems. | Infor LN is a legacy solution with limited cloud-native capabilities such as universal search, mobile experience, etc |
| Despite advanced financial traceability and technical capabilities, the functional capabilities are not as rich as with its on-prem version. | The consulting base and marketplaces are virtually non-existent for Infor LN. |
| While SAP S/4 HANA has one of the best best-of-breed solutions, they might not be as pre-integrated as other solutions. | The integration of Infor LN with MES enhances its capabilities, particularly in complex manufacturing processes. |
| In industries where it might not be the most frequently installed as an operational solution, the other solutions are likely to have deeper last-mile capabilities. | Verticals such as automotive manufacturing demand deeper integration of PLM, CAD, and vendor portals to effectively manage their unique processes. |

ERP Selection: The Ultimate Guide
This is an in-depth guide with over 80 pages and covers every topic as it pertains to ERP selection in sufficient detail to help you make an informed decision.
Conclusion
In conclusion, the choice between SAP S/4 HANA and Infor CloudSuite LN hinges on the specific needs and scale of an organization. SAP S/4 HANA stands out for its robust global capabilities, making it the preferred choice for large enterprises with extensive international operations and complex financial hierarchies. Its best-of-breed architecture, deep transactional workflows, and comprehensive support for diverse business models ensure that it can meet the demands of the most intricate and expansive organizations. However, these extensive features may seem overwhelming and unnecessarily complex for smaller companies.
On the other hand, Infor CloudSuite LN excels as an upper mid-market solution, providing mature capabilities for intricate manufacturing and distribution operations. It is particularly well-suited for discrete manufacturing sectors such as automotive and aerospace, offering integrated functionalities that rival those of larger ERP systems. While it may have some limitations in broader business model applications and cloud-native capabilities, Infor LN’s focused approach and pre-integrated best-of-breed solutions make it a powerful option for mid-sized companies or as a subsidiary solution in a two-tier ERP setup. Also, businesses must carefully assess their specific requirements with assistance from an independent ERP consultant. They can significantly aid the decision-making process, offering specialized advice and direction tailored to the specific needs of the business.
FAQs
SAP S/4 HANA vs Infor LN ERP Independent Review Read More »