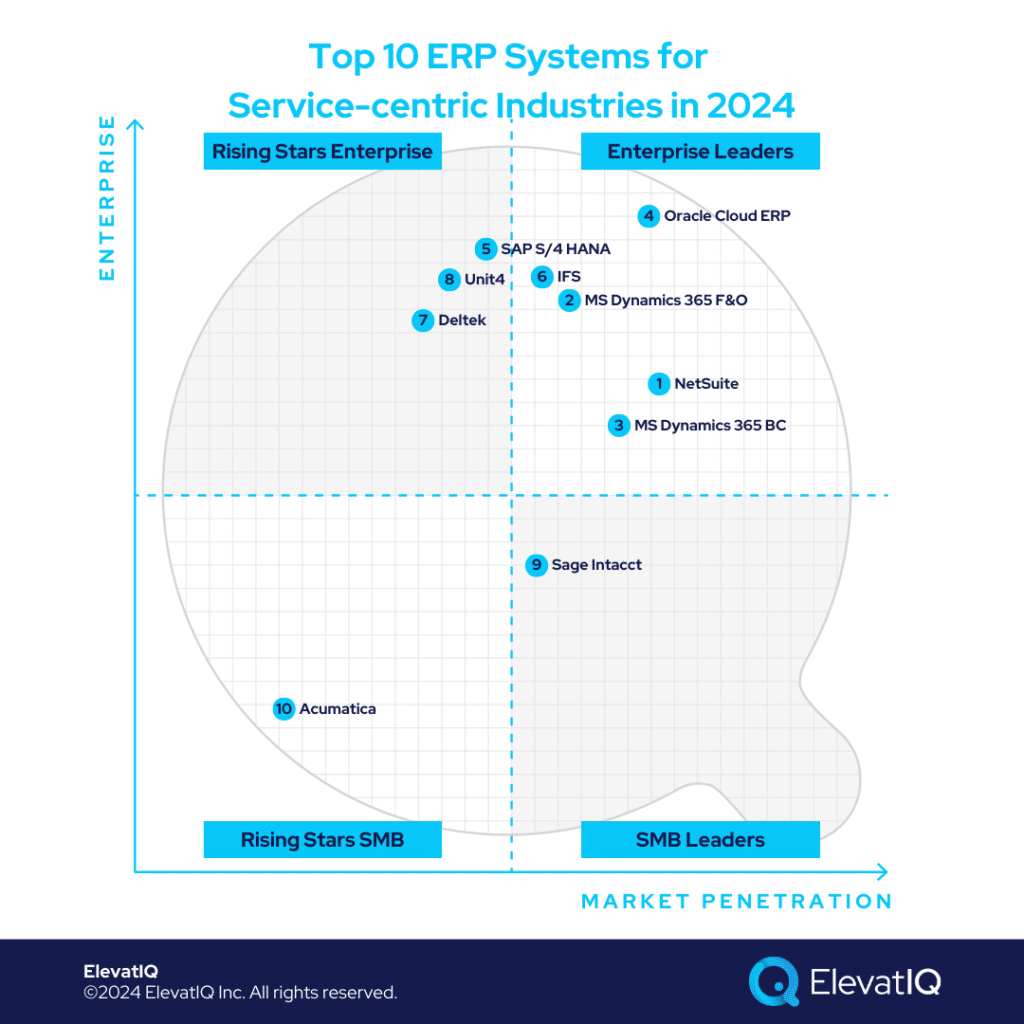
Service-Centric Businesses: Typically devoid of inventory-centric operations, ERP systems for service-centric industries demand distinctive features and architecture. Unlike their product-centric counterparts, which heavily rely on inventory-costing layers and MRP strategies, service-centric industries exhibit even more operational diversity. In some cases, ERP functions confine themselves to managing corporate financial ledgers, while custom software handles the bulk of operational tasks. This diverse industry segment ranges from non-profit organizations to the public sector, and the list goes on with particularly construction, real estate, mining, utilities, energy, consulting, and financial services.
Service-Centric Business Processes: Even within sectors like non-profit organizations, diverse needs demand extensive customizations, also raising questions about the role of ERP in such markets. Despite process variations, aspects like project management, indirect procurement, and scheduling specialized resources remain consistent. For industries like professional services and architectural firms, resource scheduling is paramount, while industries such as construction or real estate may find it less relevant. The nuances and complexities of service-centric industries necessitate an entirely unique ERP strategy for this market segment.
Service-Centric ERP Needs: PSA (Professional Services Automation) takes center stage in service-centric industries, particularly highlighting skill-based scheduling as a distinctive feature. Its integration with Human Capital Management (HCM) workflows also sets it apart. In contrast, product-centric industries prioritize embeddedness with CAD/PLM or TMS/WMS, crucial for their inventory-centric operations. Despite some inventory presence in service-centric industries, their layers are less complex, leading to occasional confusion with product-centric ERP systems. While project management and project manufacturing may resemble PSA, product-centric systems avoid skill-based resource identification to curb unnecessary overhead. Identifying ERP systems tailored for service-centric industries? This list is an excellent starting point.
The 2026 Digital Transformation Report
Thinking of embarking on a ERP journey and looking for a digital transformation report? Want to learn the best practices of digital transformation? Then, you have come to the right place.
Acumatica, primarily a product-centric ERP solution, has recently announced that they are launching an edition tailored for professional services companies. While Acumatica has capabilities relevant for other service-centric verticals, such as subscription billing, its coverage is fairly limited, primarily confined to the corporate financial ledger. Also, as of today, it has very limited global financial capabilities, making it less relevant for globally operated organizations requiring localizations in multiple countries aiming to explore synergies among those entities. Its limitations also substantially extend to non-profit-specific capabilities, but it would be a great fit for construction and mining-centric verticals due to its embedded field service and asset management capabilities. Thus, given its limited relevance to service-centric verticals, it ranks at #10 on our list.
Strengths
Multiple business models in one database. Service companies such as architectural firms and mining companies might find Acumatica attractive if their operations have flavors of product-centric companies such as manufacturing or eCommerce.
Cloud-native, with the experience being very similar to other SaaS products, such as Salesforce or Quickbooks.
Great as the first ERP system. While it would require consulting effort for implementation, the data layers are not as complex as larger ERP systems, making it a great first ERP system for service-centric smaller companies.
Weaknesses
PSA capabilities just released. The PSA module has just been released and may take some time to stabilize, even though it contains a project management module for construction-centric verticals.
HCM module not embedded. One key requirement for service-centric verticals is particularly embedded HCM and indirect procurement processes, which are substantially limited with Acumatica.
9. Sage Intacct
Service-centric companies seeking their first ERP system find Sage Intacct an ideal fit. While exclusively focusing on service-centric verticals such as non-profit, SaaS, construction, and many more, it highly limits the core ERP capabilities. They would require several add-ons in most of these sectors. Although limited to operational capabilities, it can act as the global financial ledger for global operations with enterprise-grade finance capabilities, such as partner accounting and revenue recognition. Thus, with the limited scope as an ERP requiring add-ons for operational capabilities, it ranks at #9 on our list.
Strengths
Deep service-centric last-mile capabilities. It has one of the strongest service-centric finance and accounting capabilities, also including fund and grants accounting, pre-populated KPIs, and reports.
Globalized and Localized in over 120 countries. It can natively support multi-entity collaboration features of over 120 countries.
Salesforce, HR, and Marketplace Integrations for service-centric industries. Sage owns and maintains Salesforce and payroll integrations, particularly ensuring the quality of development.
Weaknesses
May Require Subscriptions for Best-of-breed CRMs. Primarily an accounting solution. So the solution doesn’t have any CRM capabilities at all, as well as limited supply chain capabilities, even for indirect procurement.
Will Require Consulting Expertise Compared to Other Smaller Systems. While Sage Intacct maximizes audibility and compliance through its design, successfully utilizing the product would require consulting expertise and internal IT maturity to navigate the added layers.
Not a complete ERP. Would require several bolt-ons, even in verticals where they might have a tailored version. The tailored version would provide best-of-breed finance and accounting capabilities while using add-ons for everything else.
8. Unit4
Unit4 is a purpose-built enterprise-grade ERP for non-profit, public sector, and consulting companies. While ideal for some, tailored workflows would be limiting for other diverse service-centric business models such as healthcare, construction, or mining. Given its limited scope in certain industry verticals, it does not provide the best fit for service companies aiming to streamline several subsidiaries in one solution or for private equity firms streamlining their entire portfolio. Thus, with its limited relevance to certain service-centric industries, it ranks at #8 on our list.
Strengths
Strong HCM and Indirect Procurement Capabilities Pre-integrated and Pre-baked. Tailored to educational institutes and non-profits.
Non-profit Accounting and PSA Capabilities Offered Out of the Box. The non-profit package includes native capabilities for the fund and grant capabilities with a strong PSA module to manage resources and projects.
Designed to Handle Global Enterprise Workloads. While two versions exist for large enterprises and another for the mid-market, the large one has proven successful with large non-profit institutes seeking alternatives to SAP S/4 HANA or Oracle Cloud ERP.
Weaknesses
Legacy Solution. While rearchitected for the cloud, it’s a legacy solution. So, the user and mobile experience might not be as great as other options born in the cloud.
Limited Install Base in North America. Primarily a European solution with a very limited presence and ecosystem in North America. So, you might struggle to find consulting companies and marketplace add-ons focused on the North American market.
Fit for a limited number of service-centric industries. Because of its tighter alignment with non-profit and public-sector verticals, other industries might find non-profit-specific capabilities overwhelming. It might also not be a fit for diverse organizations seeking capabilities outside of their comfort zone.
7. Deltek
Deltek targets upper-mid and lower-enterprise service-centric industries in construction, government contracting, architecture, and engineering verticals. Companies seeking proprietary integration and embeddedness with government contracting workflows find it an ideal fit. However, these proprietary capabilities might be overwhelming for other diverse industries. Just like Unit4, Deltek serves as a great solution for certain service-centric verticals but might not suit other verticals or companies with diverse business models as effectively. Thus, given its limited relevance for service-centric verticals, it ranks at #7 on our list.
Strengths
Last-mile capabilities for GovCon and construction-centric verticals. Deltek has last-mile capabilities in the construction and GovCon space, requiring substantial development atop vanilla solutions.
Access to the databases and networks relevant to these industries. Deltek has several products in its portfolio with industry databases and networks, providing it a unique advantage over other vendors.
Multi-entity capabilities. Their multi-entity capabilities are rich, making them suitable for upper mid-market companies seeking one solution to host all of their entities in one database.
Weaknesses
Limited focus. The limited focus of the solution might be a challenge for service-centric verticals active with M&A cycles, especially for business models outside of Deltek’s expertise.
Limited ecosystem and consulting base. As of today, their ecosystem and consulting base significantly limit their capabilities.
Limited best-of-breed capabilities. Service-centric industries opting to build best-of-breed architecture might not find as many pre-baked integration options, requiring substantial consulting efforts.
6. IFS
IFS enjoys a unique position for most service-centric verticals with its depth in project-centric organizations. It also particularly excels in workflows tailored for asset-heavy industries, along with possessing depth in field service capabilities. While IFS would suit many service-centric verticals such as construction, energy, and utilities, it might lack operational depth for verticals such as non-profit or the public sector. Since the solution targets larger mid-market and lower enterprise companies, it might be overwhelming for smaller companies. Thus, given its broader application than other focused solutions, it ranks at #6 on our list.
Strengths
Enterprise-grade field service and asset management capabilities. While limited in its suite and focus, their last-mile capabilities are the strongest, particularly relevant for service-centric industries.
The data model is aligned with companies with large programs. Industries such as MRO, Oil, and Gas follow very different project structures and BOMs. And IFS’s data model allows them to manage complex programs without any ad-hoc arrangements.
Technology. While a legacy solution, IFS technology has rearchitected and modernized itself using cloud-native SaaS technologies.
Weaknesses
Limited focus. The limited focus might be a challenge for other service-centric verticals active with M&A cycles.
Limited ecosystem. Its presence and install base still lag behind other solutions on this list in North America.
It is not the right fit for holding and private equity companies as a corporate ledger. While IFS can provide best-of-breed capabilities in a tier-two architecture or act as the main ERP hosting most enterprise processes, using IFS solely as the corporate financial ledger might not be the best fit.
5. SAP S/4 HANA
SAP S/4 HANA fits well for large globally operated companies with the scale of Fortune 1000 companies. Its data model allows hosting most business models in one solution, but that infinite scalability might also be overwhelming for smaller companies, requiring higher IT maturity and implementation budgets. While capable of hosting most business processes, operations teams at service-centric organizations might not prefer to host their workflows inside ERP systems. Thus, the preference for decentralized architecture at service-centric companies gets it the rank of #5 on this list.
Strengths
Non-profit accounting and PSA capabilities are provided out of the box. Expect a non-profit accounting package including grant and fund reporting with a PSA and skill-based scheduling.
Best-of-breed capabilities pre-integrated. The best-of-breed software, such as Concur, SuccessFactors, and CRM, are pre-integrated with SAP S/4 HANA, a pre-baked integration with the potential to save millions of dollars.
HANA and financial traceability for large, global organizations. Because of the power of HANA, SAP S/4 HANA can process very complex transactions with visual traceability across entities, along with end-to-end traceability, auditability, and approvals of SOX compliance workflows.
Weaknesses
CRM and membership capabilities. CRM workflows might not be fluid enough to meet the unique needs of service-centric companies.
Adoption issues for service-centric verticals. Unlike product-centric organizations, service-centric verticals don’t have as financially embedded transactions, causing efficiency issues with teams if their workflows were to be managed inside complex ERP systems such as SAP S/4 HANA.
Overwhelming for smaller organizations. The data model is designed for large, complex organizations, overwhelming for smaller, service-centric organizations.
4. Oracle Cloud ERP
Oracle Cloud ERP, similar to SAP S/4 HANA, is a great fit for very large globally operated organizations, especially publicly traded companies. It can accommodate most service-centric business models as part of its solution and has tailored capabilities for non-profits along with a PSA solution that is tightly embedded with the standalone HCM solution. Compared to SAP S/4 HANA, Oracle Cloud ERP fluid architecture allows flexibility that service-centric companies need for a decentralized architecture along with an ability to create custom forms and workflows easily. Thus, with the solution aligned with the needs of service-centric companies, Oracle Cloud ERP ranks at #4 on our list.
Strengths
Designed for large service-centric organizations. The embedded HCM and CRM processes are suitable for large service-centric organizations. The P2P workflows are friendlier for the indirect procurement needs of such organizations.
Native capabilities for grant and fund accounting. Expect native capabilities for grant and fund accounting provided as part of the package with very robust budget planning tools pre-integrated and pre-populated, easily merged with external datasets.
Embedded HCM and PSA processes. Expect HCM and PSA to be fully immersed with the ERP, as well as grant and fund compliance processes.
Weaknesses
Custom CRM workflows. While Oracle Cloud ERP might support the needs of membership from the perspective of finance and ASC606, the operational capabilities would require translation of data and process model, requiring expensive consulting and internal IT expertise.
Best-of-breed pre-built integrated options may be limited. Expect substantial efforts in integrating sector-specific CRMs and tools, as options may be limited for specific service-centric organizations.
Overwhelming for smaller organizations. The data model and translations required to be successful with the product may be too overwhelming for companies outgrowing QuickBooks or other smaller ERP systems.
3. Microsoft Dynamics 365 Business Central
Microsoft Dynamics 365 Business Central is a great fit for service-centric SMB companies with diversified business models operating globally. Its project management module is uniquely tailored to the needs of professional services organizations with each resource identified. It also has non-profit-centric accounting packages provided out of the box and a best-of-breed CRM that is highly customizable. The MS ecosystem also has very highly talented developers capable of customizing the CRM data model to the most unique service-centric workflows. Thus, given its broader focus on service-centric industries, it ranks at #3 on this list.
Strengths
Designed for global companies. Natively supports global regions and localizations. Ideal fit for countries where the other suite-centric solutions, Deltek or Unit4, might not be present.
Non-profit accounting and PSA capabilities are provided out of the box. Expect a non-profit accounting package including grant and fund reporting with a PSA tailored for service-centric organizations and skill-based scheduling.
Marketplace and ecosystem. Augments core capabilities with a very vibrant marketplace, supporting diverse business models such as oil and gas, energy, and non-profit.
Weaknesses
Financial traceability and SOX compliance. It might not be the most Intuitive for finance leaders. The financial traceability may not be as intuitive as SAP for global, publicly traded service-centric companies.
Technical focus and limited business consulting expertise in the Microsoft ecosystem. The ecosystem has technical companies but with limited business consulting experience, which might drive over-customization and overengineering of Microsoft products, ultimately leading to implementation failure.
Limited Microsoft support for smaller partners. Unlike other ERP companies, Microsoft doesn’t offer any support or control to its smaller partners, leading to implementation issues because of the limited control over its channel.
2. Microsoft Dynamics 365 Finance & Operations
Microsoft Dynamics 365 Finance & Operations is a great fit for upper-mid-market and lower-enterprise companies operating globally. It can host a variety of business models in one solution, along with the flexibility of customized workflows for service-centric organizations. MS Dynamics 365 F&O includes an out-of-the-box non-profit accounting package along with best-of-breed capabilities supported through its marketplace. It also has a CRM and field service solution that can be used in conjunction with the ERP solution, making it especially relevant for certain service-centric verticals. Thus, due to its wider applicability for many different business models, it ranks at #2 on our list.
Strengths
Designed for large organizations. Ideal for large, global companies with complex service-centric business models operating in multiple countries.
Non-profit accounting package capabilities are offered out of the box. Embedded non-profit accounting capabilities are offered out of the box.
Data center options and data locations of choice might be available in most countries. With the backing of Azure, complying with regulations such as the Patriots Act may be easier, an issue especially crucial with service-centric companies.
Weaknesses
It may not be the best fit for publicly traded companies. The traceability requirements for publicly traded companies might not be as intuitive.
The CRM data model might not be as fluid for certain service-centric verticals. The CRM data model is not as fluid as other solutions in the market, making it less friendly for business users with a need for customized workflows.
NetSuite is a great fit for several service-centric verticals, including non-profit, media, energy, utilities, construction, and oil and gas. It can support not only the lighter commerce processes of service-centric businesses but also complex workflows such as subscription-based business models. NetSuite HCM and PSA provide the unique embeddedness service-based organizations need to support their skill-based operations. The FP&A and indirect procurement processes are uniquely tailored for these industries. Thus, with the introduction of field service and its CPQ being tailored, it is one of the most adopted solutions in service-centric verticals, securing its rank at #1 on this list.
Strengths
An in-built package with fund and grant accounting capabilities is offered out of the box. Expect native capabilities for grant and fund accounting provided as part of the package with very robust budget planning tools for SMB non-profit companies pre-integrated and pre-populated, easily merged with external datasets.
Marketplace and ecosystem. Vibrant marketplaces and ecosystems, with tons of pre-baked integrations and add-ons available for diverse business models.
Ideal for global companies growing through M&A. Supports several diverse and global business models out of the box, making it ideal for companies part of the private equity portfolio and growing through M&A.
Weaknesses
Limited operational depth for some verticals. The operational depth with solutions such as Unit4 or Deltek for certain verticals might require add-ons or custom development.
Embeddedness with best-of-breed solutions. Service-centric verticals that enjoy using their favorite tools, such as Salesforce or JIRA, might not like to use NetSuite for their operational workflows.
Not a fit for very large service-centric organizations. While NetSuite can support very large multi-entity operations, companies that might be acquiring hundreds of companies each year might find NetSuite to be limiting.
+
ERP Implementation Failure Recovery
Learn how Frederick Wildman struggled with Microsoft Dynamics 365 ERP implementation failure even after spending over $5M and what options they had for recovery.
In contrast to product-centric counterparts, service-centric organizations demand ERP systems with flexibility, given their ad-hoc workflows with limited financial control needs. The limited benefits of ERP processes in service-centric settings can result in adoption challenges, especially in verticals where employee experience matters more than operational efficiency. If you’re choosing an ERP system for service-centric industries, scrutinizing nuances is crucial. When ERP systems seem indistinguishable, the guidance of an independent ERP consultant can be invaluable.
FAQs
How do ERP systems for service-centric industries differ from product-centric industries?
Service-centric ERP systems require PSA capabilities, which are uniquely different from the project management or project manufacturing module of a product-centric ERP system. They might also be tightly embedded with HCM processes, which is generally not a requirement for product-centric industries.
What if a business may have both product- and service-centric operations?
In such cases, a determination needs to be made whether an organization is primarily product-centric or service-oriented. If more than 80% of the business model centers around service-centric operations, service-centric ERP systems might be a more appropriate choice.
Which specific capabilities do service-centric ERP systems generally include?
The service-centric ERP systems are lighter on inventory-centric capabilities such as cost accounting, MRP, and inventory layers. They are heavier on indirect procurement processes, skill-based scheduling, and budgeting processes.
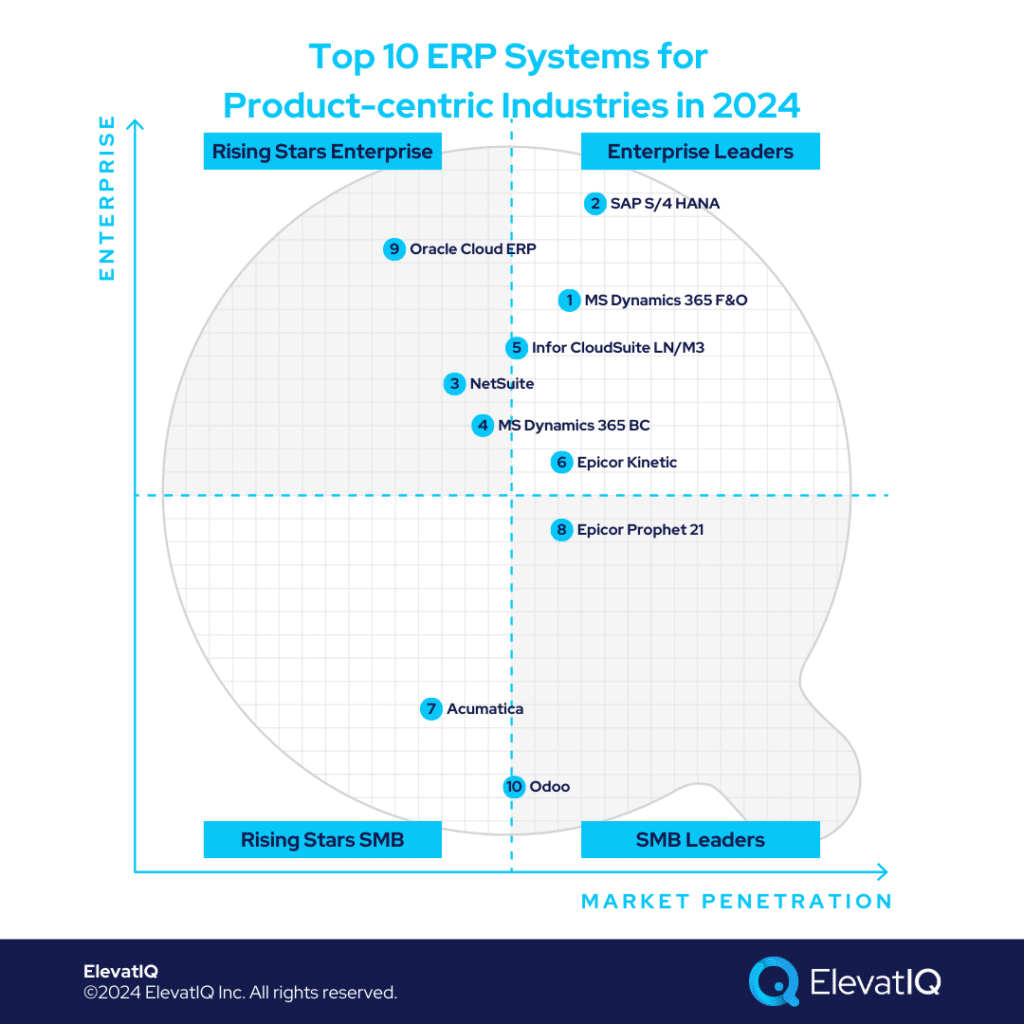
Defining Product-centric Industries. Unlike service-centric counterparts, product-centric industries heavily invest in inventory-centric operations rather than human resources and employee experience. This distinction necessitates uniquely tailored ERP systems. For manufacturers, distributors, and the entire manufacturing value chain focused on building and commercializing products, the major differentiator lies in the products they sell. Service-centric providers offering consulting services to these companies form the exception.
Business Models and Processes of Product-centric Industries. Within the product-centric industries segment, diverse business models abound, spanning discrete products to process-centric industries. Differences extend to manufacturing approaches, encompassing make-to-stock, make-to-order, configure-to-order, or project manufacturing. Additional variations arise in industrial or FMCG distribution, introducing nuances between B2B and B2C transactions. While a predominant focus on product-centric processes is common, some industries may intertwine service-centric processes, particularly if offering consulting services alongside products, adding complexity to the overall business model.
The ERP needs of product-centric industries. Tailoring ERP systems to product-centric industries hinges on their product development and commercialization processes. Varied stakeholders, including customers and suppliers, play crucial roles during the engineering phase, particularly for high-cost products. Retail and distribution models necessitate warehouse-level planning and allocation, while manufacturing-centric models involve joint forecasting and planning with suppliers and retailers. These diverse needs collectively shape the ERP requirements for product-centric industries. If you’re on the lookout for ERP systems tailored to these industries, kickstart your search with this curated list.
The 2026 Digital Transformation Report
Thinking of embarking on a ERP journey and looking for a digital transformation report? Want to learn the best practices of digital transformation? Then, you have come to the right place.
Overall market share/# of customers. The higher marketshare with product-centric industries drives higher rankings on this list.
Ownership/funding. The superior financial position of the ERP vendor leads to higher rankings on this list.
Quality of development. How modern is the tech stack? How aggressively is the ERP vendor pushing cloud-native functionality for this product? Is the roadmap officially announced? Or uncertain?
Community/Ecosystem. How vibrant is the community? Social media groups? In-person user groups? Forums?
Depth of native functionality. Last-mile functionality for specific industries natively built into the product?
Quality of publicly available product documentation. How well-documented is the product? Is the documentation available publicly? How updated is the demo content available on YouTube?
Product share and documented commitment. Is the product share reported separately in financial statements if the ERP vendor is public?
Ability to natively support diversified business models. How diverse is the product to support multiple business models in the same product?
Acquisition strategy aligned with the product: Any recent acquisitions to fill a specific hole for product-centric industries? Any official announcements to integrate recently acquired capabilities?
User Reviews: How specific are the reviews about this product’s capabilities? How recent and frequent are the reviews?
Must be an ERP product: Edge products such as HCM, CRM, eCommerce, MES, or accounting solutions that are not fully integrated to support enterprise-wide capabilities are not qualified for this list.
10. Odoo
Odoo is a great choice for product-centric startups outgrowing QuickBooks or other smaller accounting or CRM packages seeking to integrate their processes, minimizing data siloes. While Odoo is a great ERP system for companies starting on their ERP journey, its data model is leaner and designed to provide basic transactional capabilities. Among product-centric industries, Odoo could be a great fit for retail and commerce-centric startups with diverse business models operating in multiple countries. Odoo is also a superior fit in geographies where other operationally rich solutions might not be available. While great for consumerized products, Odoo might not be the best fit for complex products requiring complicated engineering and product models with deep layers of costing and MRP workloads. Well-adopted among product-centric companies, Odoo ranks at #10 for product-centric industries.
Strengths
Easier for companies outgrowing QuickBooks. The lean data model and workflows make it easier for product-centric startups transitioning from QuickBooks-like solutions.
Ecosystem and Development Help. The availability of cheaper technical talent globally helps product-centric startups extend or augment core capabilities.
Ideal for diverse product-centric startups. The data and process model supports diverse industries, especially suitable for product-centric companies selling consulting services requiring project management capabilities.
Weaknesses
Mature capabilities are not as pre-baked as larger peers. Mature capabilities such as MRP, allocation, and batch are not as detailed as with other richer ERP systems.
An open-source ecosystem might lead to inexperienced developers promoting untested and unsecured code, causing cybersecurity issues or operational disruptions.
Requires business consulting help to avoid overengineering by developers. Without access to seasoned ERP consultants, Odoo implementation is likely to run into implementation or adoption challenges.
9. Oracle Cloud ERP
Oracle Cloud ERP is a great choice for global product-centric enterprises. While major penetration of Oracle Cloud ERP is among service-centric verticals, it might be a fit for some product-centric verticals where the operational processes might not be as complex or hosted inside ERP. An example of such verticals would be retail, where the scope of ERP might limited to a corporate financial ledger. Oracle Cloud ERP is also a great choice for product-centric enterprises with evolving business models due to active acquisition cycles. An example of such companies would be either the holding companies or companies part of the PE portfolio requiring streamlining processes on one ERP system across the enterprise globally. Given its relevance and adoption among some verticals for product-centric industries, it ranks at #9 on our list.
Strengths
WMS and TMS Capabilities Bundled with the ERP. Oracle Cloud ERP has WMS and TMS processes tightly embedded as part of the ERP transactions, and it is especially friendly for retail and 3PL-centric operations.
Proven Solution with Large Workloads.Large product-centric companies may process millions of GL entries per hour. The workload Oracle Cloud ERP is designed to handle.
Ecosystem. It has an ecosystem of experienced consultants who have the capabilities to handle the design and architecture of such complex enterprises.
Weaknesses
Limited Last-mile Capabilities. The last-mile capabilities for specific product-centric verticals, such as industrial distribution or complex manufacturing, might be expensive to configure and implement.
Not necessarily a Product-centric Solution. While installed with some large enterprises, it’s major focus is on service-centric verticals.
Overwhelming for SMB product-centric companies. Not a fit for SMB product-centric companies looking for a turn-key solution tailored to the processes of the specific micro-vertical.
8. Epicor Prophet 21
Epicor Prophet 21 is a great choice for industrial distributors seeking deeper operational capabilities with the flexibility of replacing most components offered as part of the Epicor Prophet 21 suite. The requirements for specialized tools or integration with third-party best-of-breed systems might lead to expensive and uncontrollable implementation costs. While Epicor Prophet 21 might be a great choice for smaller pure-play industrial distributors, it might not be the best choice for diverse product-centric companies operating globally. Given its relevance and adoption among industrial distribution companies but with limited application for other diversified product-centric industries, it ranks at #8 on our list.
Strengths
Rich Industrial ERP Distribution Systems Capabilities Provided Out-of-the-box. The system natively supports complex relationships between vendors and suppliers (and buying groups), along with capabilities such as branch accounting, retail-centric material flow, and warehouse architecture.
Best for Prescriptive Architecture. Epicor Prophet 21 is a good fit when you can replace/use the systems provided in the Epicor ecosystem, such as payment providers, POS systems, shipping add-ons, and marketplace integrations.
Pre-integrated with Other Best-of-breed Industrial B2B Systems.Integration with other best-of-breed industrial eCommerce systems, such as Optimizely or Unilog, is pre-baked.
Weaknesses
Limited Capabilities to Support Diverse Distributors. Only fit for businesses with traditional business models with a limited number of channels. Not fit for modern distributors and DTC-centric businesses.
Legacy Technology. While the new Kinetic experience can offer mature cloud capabilities such as enterprise search, the underlying data model and other cloud capabilities, such as mobile, are still legacy and patchy.
Ecosystem. Limited number of consultants and partners available to support the product. The marketplace is extremely limited to create the best-of-breed architecture.
7. Acumatica
Acumatica is a great choice for diverse product-centric companies from $10-$100M in revenue operating in a handful of developed countries. It is especially friendly for companies with diverse product-centric business models ranging from manufacturing, retail, and distribution, aiming to explore synergies among these operations. While great for diverse product-centric companies, it might not be the best for companies over $100M seeking mature ERP capabilities, such as complex MRP runs or allocation cycles. But it’s a great fit for smaller companies with limited implementation budgets. Given its relevance for smaller product-centric companies, it ranks at #7 on our list.
Strengths
B2B and B2C Products. Its data model is friendly for B2B businesses, with support for complex customer hierarchies and pricing (and discounting layers). It also supports divisional/branch accounting with warehouse-level pricing and replenishment strategies.
Diverse Capabilities to Support the Needs of Multiple Business Models. Support for hybrid business models in the same product/database, such as manufacturing and distribution (or manufacturing combined with construction, DTC, or field service).
Cloud-native UI and Flexible Pricing Options. Consumption-based pricing options reduce costs substantially for certain business models, such as seasonal businesses with labor spikes.
Weaknesses
Limited Global Capabilities. The current multi-entity functionality might be limiting for companies with operationally connected offshore locations.
Limited Mobile Reporting Capabilities. The mobile capabilities are leaner for complex reporting scenarios such as parallel processing.
Multiple Add-ons may be Required for Regulated Industries and Complex Manufacturing. Requires several add-ons, such as MES, PLM, and quality, posing integration and communication challenges.
6. Epicor Kinetic
Epicor Kinetic is a great choice for companies with complex manufacturing and distribution operations in the industrial verticals. Its product data model is especially friendlier for complex, regulated industries with formal engineering processes. It can also support project-centric manufacturing and distribution-centric operations with the same product. While great for manufacturing, it’s not as great for diverse operations, especially for FMCG or retail-centric product companies. Given its relevance among manufacturing companies but limited applicability for other business models globally, it ranks at #6 on our list.
Strengths
Strong for Companies with Formal Manufacturing Processes. Mandatory revision numbers and the BOMs driven by revision numbers would be especially appealing for formal engineering organizations with their BOMs aligned to Epicor Kinetic’s data model.
Strong with Complex Inventory Needs. Companies requiring multiple attributes that need to be part of the planning and MRP, such as metal, fastener, automotive, and aerospace, would find Epicor Kinetic appealing.
Microsoft Look-and-feel. Epicor has a very similar look and feel to Microsoft ERP products, providing you with the same experience but with much deeper last-mile capabilities where other products might struggle.
Weaknesses
Global Financial Operations. Unlike larger products that might support more than three layers of financial hierarchies, such as corp, subsidiary, entity, and business units, the limited number of layers would require operationally inefficient workarounds, such as using sub-accounts for such traceability.
Embedded Experience with Field Service and Quality. Despite recent acquisitions, the field service capabilities are not as embedded, making it challenging for some product-centric verticals, such as aftermarket, where such capabilities are essential.
Weak Ecosystem and Marketplace. Epicor takes a suite approach to its products while selling directly to its customers, limiting the overall consulting and marketplace penetration.
5. Infor CloudSuite LN/M3
Infor CloudSuite LN and M3 are two completely different products, targeting large manufacturing companies in the upper mid-market and lower enterprise segments. LN targets complex manufacturing products such as rocketships, satellites, or construction machinery. Meanwhile, Infor M3 suits apparel, F&B, and chemical manufacturing. They might be great for pure-play manufacturing capabilities, but they might not be the best fit for other product-centric verticals such as pure-play retail or distribution. Given their relevance for manufacturing companies with limited applicability for other verticals, it ranks at #5 on our list.
Strengths
Global Operations. Only solutions in the market with sufficient financial hierarchies and global trade compliance functionality pre-baked with products to support manufacturers exploring global financial and operational synergies.
Last-mile Capabilities Along With Breadth of Capabilities for Diversified Manufacturing Business Models. Verticals such as apparel manufacturing require the deeper integration of PLM, vendor portals, and merchandising solutions. Complex manufacturing requires handling units, several layers of allocation management, and international trade compliance.
Best-of-breed Integrations Offered Out-of-the-box. Most tools that a manufacturer would require, such as HCM, PLM, data lake, ERP, WMS, TMS, and advanced supply chain planning, are all pre-integrated with LN and M3.
Weaknesses
Might Not be the Best Fit as a Corporate Solution for Holding and Private Equity Companies. Holding companies as diverse as manufacturing, construction, and professional services may not be able to keep all of their entities on one solution.
Legacy UI and Experience. Infor LN and M3 are both legacy solutions with technical limitations to provide the cloud-native experience with universal search, mobile experience, etc.
Weak Ecosystem and Marketplace. The consulting base and marketplaces are virtually non-existent for both Infor LN and M3.
4. Microsoft Dynamics 365 Business Central
Microsoft Dynamics 365 Business Central is a great fit for globally diverse SMB companies seeking to host multiple product-centric business models in one solution. Its data model is especially friendly for FMCG and pharma-centric companies, with an ecosystem containing add-ons to support most business models. With the limited operational depth, it might require several add-ons and might not be the best fit for companies seeking depth with industrial distribution or manufacturing. Given its wider application and broader relevance for several product-centric business models, it ranks at #4 on our list.
Strengths
Rich Distribution ERP Systems Capabilities Natively Supported. Replenishment strategies such as warehouse-level transfers, license plate construction, and bin-level capabilities are supported out-of-the-box for complex distribution businesses.
Cloud-native Architecture. The product has been completely rearchitected using the cloud-native architecture.
Global Capabilities and Ecosystem. Unlike several products such as Acumatica, which is primarily a North American product, it has support for several European, Asian, and African countries where most products might struggle.
Weaknesses
Limited Capabilities to Support Diverse Product-centric Companies. Only fit for FMCG-centric distributors. The industrial distribution would require add-ons to support capabilities such as buying groups, HVAC code integration, and vendor catalogs.
Unproven Add-ons and Unqualified Consulting Networks. Microsoft partner processes are not as streamlined as other vendors. So it may require the help of an independent ERP consultant to vet the add-ons and architecture in the Microsoft ecosystem.
Ecosystem. While the ecosystem may have options for distribution industries where BC specializes in, it might not have integrations with the best-of-breed eCommerce systems in the industrial distribution space.
3. NetSuite
Like Microsoft Dynamics 365 Business Central, NetSuite is a great fit for globally operating SMB companies requiring multiple business models hosted in one solution. With the capabilities built to support operations for both publicly and privately owned companies, its application is much broader compared to other solutions. While great for diverse business models, it might not be the best fit for complex industrial distribution or manufacturing requiring a much thicker add-on. Given its broader application for various business models among product-centric companies, it ranks at #3 on our list.
Strengths
B2C Data Model and Processes. NetSuite’s data model is especially attractive for B2C companies with integration requirements with several B2C channels, such as marketplaces.
Global Capabilities. NetSuite can natively support the localization requirements of more than 100 countries. As well as consolidating and supporting intercompany transactions.
Limited B2B Capabilities. The data model and pricing are not friendly for B2B companies. The pricing layers are not as scalable as other systems, such as Acumatica. NetSuite may struggle with the complex product catalog for industrial distributors.
Limited Capabilities for Diverse Distributors. Distributors with diverse business models with manufacturing, construction, or field service might require several add-ons.
Not Designed for Large Companies. NetSuite may struggle with transactional workload requirements of companies over $1B, especially for transactional businesses aiming to process their end-to-end transactions inside NetSuite.
2. SAP S/4 HANA
SAP S/4 HANA is a great fit for large, global enterprises operating globally, publicly or privately owned. Its product model can support MRP runs of very complex product-centric organizations aiming to find synergies globally, whether in a shared services model or in two-tier settings. While great for larger organizations, it might not be the best fit for smaller companies with limited IT budgets. With one of the strongest capabilities for product-centric companies seeking mature ERP capabilities after outgrowing smaller ERP packages such as Acumatica or NetSuite, it ranks at #2 on our list.
Strengths
Large Workloads. SAP S/4 HANA could process more than 100K serialized goods receipts within 22 secs while Oracle Cloud ERP took more than 18 mins for the same test. SAP S/4 HANA’s design allows companies to process the workload requirements of Fortune 500 when every other system might struggle.
Best-of-breed Architecture for Distributors. SAP’s best-of-breed architecture can support the business model of large distributors, irrespective of whether they are a traditional distributor or a combination of 3PL, which typically has a different warehouse and TMS architecture than traditional distributors.
Financial Traceability and Control. Fortune 500 organizations with shared service models spread in multiple countries would appreciate the financial traceability built at the document level.
Weaknesses
Weak Operational Capabilities for the Cloud. The last-mile capabilities available with some of the mid-market products may require substantial development with SAP S/4 HANA.
Limited Pre-baked Integration. The third-party integration options such as integration with eCommerce platforms, POS systems, channel connectivity, etc may require substantial development efforts.
Overwhelming for Smaller Organizations. The complex workflows built to support the processes of large, complex organizations may overwhelm organizations seeking simpler solutions without unnecessary processes and approval flows.
1. Microsoft Dynamics 365 F&O
Microsoft Dynamics 365 F&O is a great fit for global companies in the upper mid-market or lower enterprise segment seeking mature cloud ERP capabilities. Unlike smaller ERP systems such as NetSuite or MS Dynamics 365 Business Central F&O would not require as many add-ons, simplifying the implementation and limiting implementation risks. While great for larger global companies, it might not be the best fit for smaller product-centric companies. With its equal depth for both discrete and process-centric verticals, it’s one of the most diverse solutions on this list. Given its wider adoption for several business models among product-centric companies, it ranks at #1 on our list.
Strengths
Operationally Richest Cloud Product for Large Complex Businesses. Businesses that have multiple global entities with complex business models such as discrete and process manufacturing, distribution, and project-based business models would find Microsoft Dynamics F&O attractive.
Cloud-native Architecture. The product has been completely rearchitected using the cloud-native architecture. Cloud capabilities are stronger than competing products for distributors such as SAP S/4 HANA and Oracle ERP Cloud.
Common Data Model and Database-level Integration for Best-of-breed Architecture. Large, complex systems could be frightening to use for sales and field service crews. Microsoft provides pre-baked integration with the best-of-breed CRM and field service products.
Weaknesses
Financial Traceability and Audit Support. Complex global organizations may struggle with financial traceability and SOX compliance capabilities.
Large Workloads. Compared to SAP S/4 HANA, it might not be able to match the performance expectations of large complex organizations where companies may need to process millions of journal entries per hr.
Overwhelming for Smaller Organizations. The complex workflows built to support the processes of large, complex organizations may overwhelm organizations seeking simpler solutions without unnecessary processes and approval flows.
+
ERP Implementation Failure Recovery
Learn how Frederick Wildman struggled with Microsoft Dynamics 365 ERP implementation failure even after spending over $5M and what options they had for recovery.
Despite apparent similarities, ERP systems for product and service industries are distinctly different, creating potential confusion due to shared terminology. Crucially, the inventory requirements diverge significantly between service-centric and product-centric organizations. If you are selecting an ERP System for Product-Centric Industries, be sure to scrutinize the intricacies of inventory layer structures, focusing on alignment with the specific needs of product-centric industries. Opting for an independent ERP consultant is a wise choice, especially if navigating these nuances isn’t part of your daily routine.
FAQs
How do ERP systems for product-centric industries differ from service-centric industries?
Product-centric ERP systems are designed for inventory-centric operations, while service-centric ERP emphasizes human resources operations and indirect procurement processes, which might not be as relevant for product-centric operations.
What if a business may have both product- and service-centric operations?
In such cases, a determination needs to be made whether an organization is primarily product-centric or service-oriented. If more than 80% of the business model centers around product-centric operations, product-centric ERP systems might be a more appropriate choice.
Which specific capabilities do product-centric ERP systems generally include?
The product-centric ERP systems are likely to have very strong capabilities for inventory management, with unit costing modules heavily integrated. Depending upon the business model and transactions, it might also include complex layers for SKUs and BOMs, with workflows supported for many different inventory types.
In the realm of real-time transportation visibility platforms, apparent similarities abound, with each touting comparable capabilities. Yet, distinctions emerge; some specialize in specific modes, while others offer multi-modal prowess. Geographic coverage further diverges, with prevalence in North America for some and exclusive focus on Europe for others. While some function as standalone applications, their primary role lies in empowering supply chain control tower applications—integral solutions seeking to finalize the supply chain equation through carrier-centric data.
Though widely embraced, real-time transportation visibility platforms represent a relatively recent phenomenon. Previously, such capabilities were unattainable due to the absence of industry-wide traceability. Although, the advent of carrier networks and ELD regulations has now unlocked these datasets. These newly accessible datasets wield substantial power independently and, when correlated, amplify the insights furnished by these platforms. Real-time visibility platforms extend beyond supply chain traceability, delving particularly into advanced scenarios like transportation risk management across geopolitical boundaries facilitated by technologies like blockchain.
The deployment of RFID chips on containers facilitates detailed traceability, particularly encompassing international multi-party BOM tracking. Platforms enhanced with AI and ML showcase impressive KPIs, achieving a 99.99% accuracy in delivery ETA. Notwithstanding pre-established networks and datasets, challenges arise in onboarding current carriers, potentially leading to misleading insights and incomplete traceability. Thus, platforms offering a superior user experience and streamlined onboarding processes are likely to provide enhanced insights. While the suitability of these platforms varies, some are tailored for SMB customers, and others are designed as enterprise-grade solutions. Now, let’s delve into the top 10 real-time transportation visibility platforms in 2024.
The 2026 Digital Transformation Report
Thinking of embarking on a ERP journey and looking for a digital transformation report? Want to learn the best practices of digital transformation? Then, you have come to the right place.
TruckerTools is perhaps the smallest solution on this list, targeting freight brokers to see load visibility. The number of modes is substantially limited, without the coverage for modes such as air or ocean. With the limitation of its network, it might not be the best fit for companies seeking a platform with international multi-modal traceability.
Pros
ELD integration. While the platform is relatively smaller, ELD integration allows data to be acquired in an autonomous fashion without relying on manual acquisition.
Detailed visibility. While not as comprehensive with the coverage, the visibility use cases are detailed.
Cons
Does not cover other modes of transportation, such as air or ocean. The visibility is primarily limited to trucking data, making it not a right fit for multi-modal traceability.
Clunky UI. The clunky UI might lead to poor adoption among carriers, making data collection harder and insights misleading.
IntelliTrans, compared to TruckerTools, is slightly richer with its capabilities, especially for multi-modal scenarios. While it covers several models, the network coverage is limited compared to other advanced tools such as Project44 or FourKites. It is a great option for SMBs looking for multi-modal capabilities with some level of TMS integration provided, but may not the best fit for large enterprises seeking comprehensive network coverage and end-to-end supply chain traceability.
Pros
SMB-friendly. While not as comprehensive a network for exhaustive multi-modal traceability, the costs and leaner layers of the software make it SMB-friendly.
Multimodal features. Compared to TruckerTools, it covers more modes such as road, rail, and ocean than being just limited to trucking data.
Integrated TMS. Integrated TMS would reduce consulting costs, but further vetting may be required to ensure the use cases supported by pre-integrated workflows would work for the datasets and the use cases that need to be supported.
Cons
Limited to road, rail, and ocean. Limited coverage might lead to misleading and incomplete insights but may be OK for companies on a budget.
Not designed for large enterprises. Large enterprises requiring mature capabilities such as AI and ML, with comprehensive coverage for networks, might find it limiting.
Ecosystem limited. The companies consulting on the tool might be limiting, making it harder to find talent relying on vendor-provided professional services.
8. Blume Global
Blume Global is another option for SMB companies needing global visibility with multimodal features. Post-acquisition with WiseTech, it can now offer broader capabilities, including pre-integrated TMS offerings, just like Trimble. Due to the limited AI and ML workflows and network coverage, it might not be the best fit for companies seeking mature capabilities.
Pros
Multimodal features. This is especially helpful for companies seeking global traceability across most modes.
Integrated TMS. The integrated TMS would reduce consulting costs, but further vetting is required to ensure the usability of pre-integrated workflows.
Now part of WiseTech Global group. Due to the integration with WiseTech Global Group, its financial sustainability would not be an issue.
Cons
Ecosystem limited. The limited ecosystem makes it challenging to find talent and a consulting base compared to larger peers.
Not as well adopted or funded as other options. While it is part of the WiseTech group, it’s not as adopted as other options such as Project44 or FourKites.
Not as comprehensive as other options on this list. The network is limiting, making the datasets potentially biased and misleading for companies seeking multi-modal traceability.
7. Overhaul
Overhaul is an enterprise-grade option for companies seeking global trade traceability and transparency. It has some unique capabilities, such as integrated RiskGPT, helping companies manage their risks. However, the platform might not be built as other solutions on this list, with limited options to mine relevant insights.
Pros
Great transportation visibility tool. This is especially useful for companies seeking global traceability, especially in areas such as insurance, theft, etc.
GSOC feed integrated along with visibility. The integration of GSOC data makes it unique for risks and security-centric workflows.
AI and RiskGPT capabilities integrated. Compared to smaller options limited with AI capabilities, it features richer AI and RiskGPT capabilities for risk forecasting and prevention.
Cons
Communication errors between the carrier and the platform. The communication between the carrier and the platform might not be as seamless, causing issues with communication and leaving datasets unreliable.
The limited network may require carriers to participate. Because of the limited network, companies would be required to invite their carriers that might not already be on the platform, making the adoption harder and insights potentially biased and misleading.
Not as well as designed and might be cluttered with GPS pings. While the system has tons of data, navigating through data might be a challenge because of the missing scalable layers to customize insights relevant to each user in the company.
6. Trimble Transporeon
Trimble Transporeon is a comprehensive solution, particularly strong with the carrier and trucking side of data, making it ideal for transportation companies or companies with internal fleets, such as agriculture or construction. It might not be the best fit for enterprises seeking mature capabilities with AI and ML workflows and multimodal traceability through the international supply chain.
Pros
Over 150K carriers are part of the network. One of the largest sample sizes of carriers, making carrier adoption easier.
Integrates with over 3000 ERP and TMS systems. The pre-integrated workflows help mine data and with integration without expensive consulting costs.
Power of Trimble’s powerful maps and telematics technology, timeslot, and retail timeslot management. Trimble’s unique offering includes powerful maps and telematics technology, augmenting ELD and carrier-centric data and providing more accurate metrics.
Cons
Mainly an European solution. While a comprehensive network, its geo exposure is limited, with Europe being the main focus, struggling in other geographies such as North America.
Relies on some datasets on other players, such as Roambee. Due to the limited datasets, they rely on other providers for some datasets, such as Roambee.
Not as comprehensive as other solutions on this list. While a great solution for several industries, it’s not as comprehensive as some of the other solutions on this list.
5. Shippeo
Shippeo is great for companies looking for road transportation visibility, mainly focused on Europe. It’s network is not as comprehensive as other solutions such as Project44 or FourKites, especially covering different geographies. While a great solution for Europe, it might not be the best fit for companies seeking global traceability across all modes.
Pros
Carbon emission tracking. One of the unique advantages of Shippeo is that it provides carbon emission data, especially useful for geographies such as Europe where carbon emissions tracking may be used as an input for planning and reporting.
Accurate truck positioning. Due to the rich datasets, it can provide far superior positioning of trucks, making ETAs far more reliable and helping with planning, generally difficult with other tools that might not be as accurate with truck positioning.
Machine learning to calculate ETA. Shippeo is packaged with machine-learning capabilities to complete the missing datasets.
Cons
Network not as strong as other platforms. The current network is not as strong as other solutions, such as Project44 or FourKites.
Mainly a European solution as well. Since it is focused on Europe, companies in other geographies might find it challenging.
Not integrated suite as other platforms. The other platforms on this list have more integrated capabilities, augmenting limited datasets and providing richer insights.
4. Descartes (MacroPoint)
Descartes MacroPoint is the best for global freight visibility and carrier capacity for logistics-intensive businesses such as freight brokers or logistics service providers. Unlike other solutions on this list with limited data and security models, Descartes MacroPoint offers enterprise layers that accommodate the needs of different personas, ensuring the right insights for the right user profiles. Descartes MacroPoint would not be a great fit for SMB companies seeking a simpler solution with a limited budget.
Pros
The ability to fine-tune alerts and accurately track the driver’s location all the time. The systems with limited data and security layers make gleaning insights overwhelming, impacting product adoption.
Global coverage. It’s not as limited as other SMB solutions on this list, with its coverage for various geographies.
Focus on logistics-centric businesses. Logistics-centric businesses have a very unique need, with a primary focus on international BOM data, where Descartes is extremely strong.
Cons
Expensive. While great from a coverage perspective, smaller companies might struggle to justify the price tag.
Carrier performance might not be as strong. Compared to other options on this list, carrier performance data might not be as strong, leaving a critical dataset for end-to-end traceability.
Designed from the perspective of logistics providers, limited carrier network. While great for logistics service providers as they have unique needs, it might be limiting for diverse business models.
3. e2open
e2open is the best for global companies looking for a complete suite, including network, planning, and execution. While it relies on other solutions, such as FourKites and Project44, for carrier-centric data, it could be a powerful for companies seeking real-time transportation visibility platforms because of other datasets, enriching the transportation data and completing the supply chain equation. It might not be the best fit for companies seeking simpler solutions.
Pros
Complete suite. The biggest advantage of e2open is that it’s a complete suite, combining all modes and geographies, making it one of the strongest platforms for end-to-end supply chain traceability.
Combined network channel and carrier. e2open has its own network, making the adoption far easier for companies onboarding their existing carriers.
Richer data and analytics. The AI and ML capabilities and the power of the network, along with the security and data layer, offer decision-grade data that might not be available through any other platforms.
Cons
Relies on Shippeo for transport visibility data. While e2open has some carriers and data, it relies on Shippeo for the datasets, posing sustainability issues if it loses its relationship with Shippeo or if Shippeo gets acquired by a competitor.
Expensive. With the amount of capabilities packed as part of the solution, it might be cost-prohibitive for SMBs.
It is not the best fit for companies looking for a standalone RTV platform. e2open is a suite and not necessarily an RTV platform if the cross-functional alignment might be a challenge, and this platform needs to be purchased at the departmental level.
2. FourKites
FourKites is perhaps the best platform for enterprises seeking standalone real-time transportation visibility platforms. It has global coverage across all modes. But might not be the best for companies seeking suite capabilities across the supply chain and not just transportation. Also, it might not be the best fit for SMBs seeking an affordable solution.
Pros
490K Carriers, ETAs 6x more accurate, 98% of global ocean traffic, and 17K airports. Compared to other solutions on this list, FourKites has one of the most comprehensive coverage and is more accurate because of its data coverage.
1.5M monthly parcel and last mile load. The inclusion of parcel and last mile load is an added advantage and a critical component for end-to-end transportation traceability.
Visibility past transportation to include yards, warehouses, and stores. While the purpose is to include just the transportation visibility, including yards, warehouses, and stores, it helps with end-to-end visibility of the entire transportation value chain.
Cons
Expensive. The comprehensive datasets and AI and ML capabilities to forecast decision-grade data make it expensive for SMBs.
Not as strong with service parts. The intent of the platform is not to provide the supplier-side of traceability. So it would not be a great fit for the supply chain visibility needed for supplier collaboration in business units such as spare parts businesses.
Limited integration with other TMS systems. Some of the TMS systems might not be as integrated, requiring companies to spend on consulting efforts.
1. Project44
Project44 is the best for SMBs seeking standalone real-time transportation visibility platforms. Compared to FourKites, Project44 is relatively friendlier for SMBs. It also provides a guarantee for carrier compliance, a huge risk for companies struggling to get their carriers on the platform, leading to misleading insights and unreliable data. Project44 is also GDPR-compliant, making it friendlier for geographies such as Europe.
Pros
Carrier compliance guarantee. One of the biggest challenges in being successful with real-time transportation visibility platforms is carrier onboarding. Project44 not only has one of the largest carrier onboarding, minimizing the need to onboard as many carriers. But they also offer a guarantee because of how streamlined the process is.
230K+ carriers, 760 ELD providers over more than 48 countries, 4.33 million drivers, 3.55 M trucks, 800K fleets. These data points make them one of the largest global networks.
GDPR compliant. Project44 is perhaps one of the few systems that are GDPR-compliant, highly relevant for companies with a presence in the European market.
Cons
Steep learning curve. The enterprise and scalable layers might require change management and training budget, which also might be out of reach for some SMBs.
Not an open platform. The open platform makes it easier and creates trust for carriers to join. While they are not open, they are one of the largest networks. Not being open might lead to mistrust among carriers and, as a result, their resistance to joining the network.
Requires carriers to agree on connecting. Carriers might not agree to join the network, thus leading to misleading insights and incomplete data, which is where their guarantee might be helpful.
+
ERP Implementation Failure Recovery
Learn how Frederick Wildman struggled with Microsoft Dynamics 365 ERP implementation failure even after spending over $5M and what options they had for recovery.
Choosing real-time transportation visibility platforms necessitates insight into the underlying network, particularly data sources. Without this awareness, platforms may seem indistinguishable, potentially resulting in misguided choices. While some aspects, like platform vetting, maybe within your control, poor user experience could hinder adoption within your carrier network, impacting desired outcomes. If you’re exploring the top 10 real-time visibility platforms, consider leveraging the expertise of independent supply chain consultants for a successful selection.
FAQs
What are real-time transportation visibility platforms?
Real-time transportation visibility platforms are advanced software solutions for tracking shipments and vehicles in real time. They use GPS, RFID, and carrier networks to optimize logistics and enhance supply chain visibility.
How do real-time transportation visibility platforms differ?
These platforms vary in capabilities, coverage, and target users. Some specialize in specific modes or regions, while others offer global multi-modal solutions. Differences also exist in integration, user interface, and pricing structures.
What should I consider when selecting a platform?
Consider coverage, integration with existing systems, user experience, cost, and support reliability. Choose a platform that meets your needs in terms of functionalities, usability, and overall value for your budget.
Before the advent of supply chain business networks, industries depended on research and survey-based approaches for supply chain planning. Companies in the data business often erred significantly, leading to inefficiencies throughout the supply chain. Establishing networks was challenging due to communication standard disparities and the difficulty of persuading the entire industry to converge on a single platform. While business-to-business communication relied on standards like XML or EDI, they offered limited connectivity and acknowledgment without centralized repositories to drive industry-wide supply chains.
As EDI networks expanded, they evolved to extract valuable data, especially for carriers. However, the supply chain equation still lacked traceability. Mode-specific networks emerged, effectively connecting stakeholders within each mode. Yet, achieving end-to-end supply chain traceability and control tower capabilities remained elusive due to industry-wide data silos. Recognizing this challenge, private equity firms saw the necessity of consolidating these silos into comprehensive networks that encompass various supply chain elements.
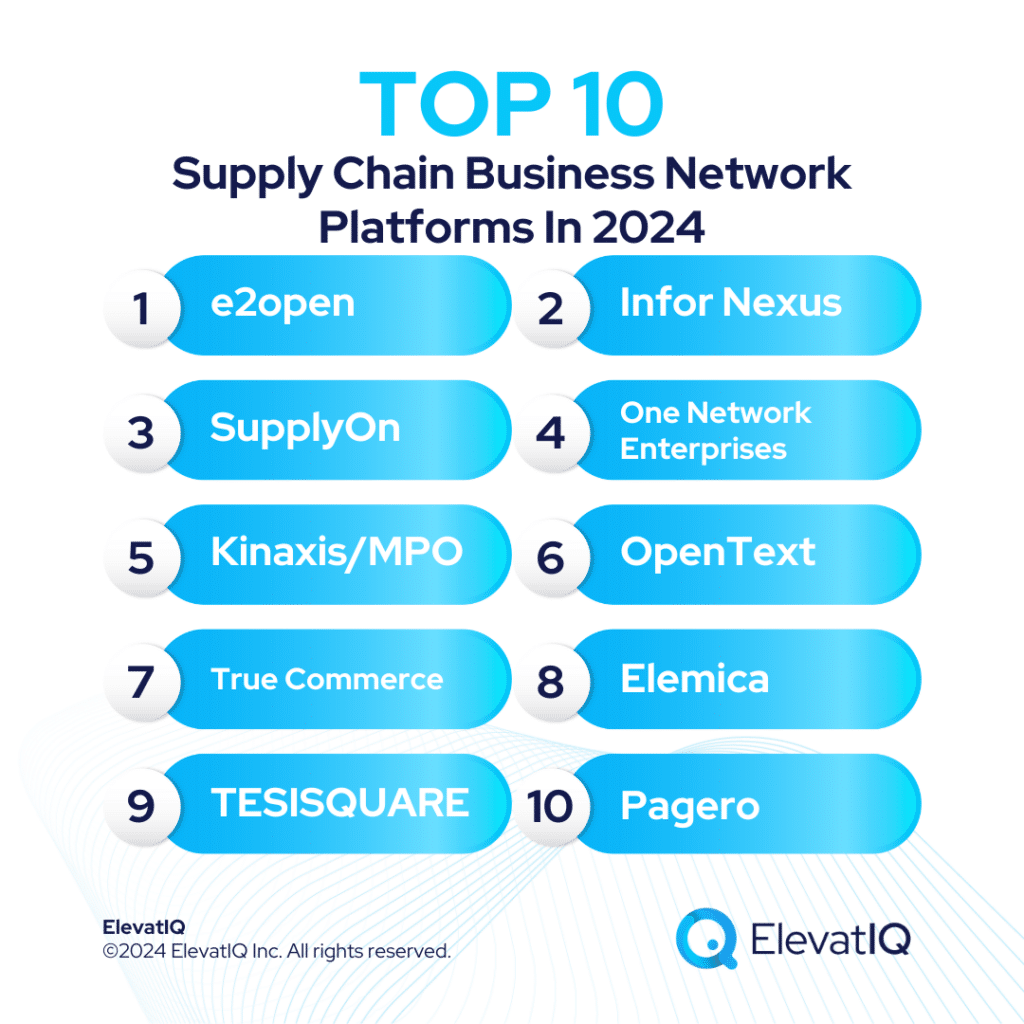
Unlocking the full potential of technology, achieving supply chain traceability requires strategic approaches. Managing domestic communication networks is feasible, yet crossing geopolitical boundaries introduces unique challenges. Global traceability remains elusive, given national security and data privacy concerns. Blockchain technology emerges as a solution, seamlessly connecting datasets while upholding security interests. The landscape expands with ESG and e-invoicing initiatives, broadening the equation. While the origin of each network varies, each serves a distinct purpose. These networks not only ensure end-to-end traceability globally but also supply essential data for AI algorithms, transforming demand forecasting. Intrigued about the top 10 supply chain business network platforms in 2024? Let’s delve into the exploration.
The 2026 Digital Transformation Report
Thinking of embarking on a ERP journey and looking for a digital transformation report? Want to learn the best practices of digital transformation? Then, you have come to the right place.
Just like the role OpenText played for enterprise e-invoicing and document exchange for the stakeholders across the supply chain, Pagero’s cloud-native platform filled the same gap for SMBs, offering them a network very similar to OpenText. Pagero would be relevant if you are looking for a good document exchange solution, including e-invoicing support with trading partners for various markets. While Pagero’s network fills the gap with critical supply chains, they are not the best fit if you are looking for a vendor that could provide end-to-end supply chain visibility and traceability data, ranking at #10 on this list.
Pros
Cloud-native interface. Pagero technologies are cloud-native, making vendor onboarding super easy, allowing you to not only use the vendors and carriers already on the network but invite your trading partners to the platforms as well, expanding the network even further.
Easy connecting with trading partners. Connecting and onboarding new vendors could be done with a few clicks, reducing the friction and resistance of those who might not be willing to join the network because of friction in the process.
E-invoicing compliance capabilities. Not many technologies in the market can allow true eInvoicing capabilities, which are critical to comply with processes in several countries, even for custom compliance requirements.
Cons
Limited to document exchange. The scope of the network is limited to document exchange related to eInvoicing and communication with trading partners.
Limited suite capabilities. Companies looking for an entire suite that could utilize the data generated by the network might not be the best fit.
Not a real supply chain business network. It’s not necessarily a supply chain business network, but it does provide critical capabilities to communicate with supply chain stakeholders.
9. TESISQUARE
TESISQUARE presents a unique network origin, initially focusing on supplier collaboration within manufacturing and engineering value chains. Unlike carrier or eInvoicing networks, its strength lies predominantly in the European market, offering specific capabilities within the supply chain. While not comprehensive for the entire supply chain, it excels as a supplier collaboration network with strength within the SAP ecosystem. TESISQUARE secures a spot at #9 on our list, providing control tower features geared toward tracking supplier collaboration.
Pros
Strong competence with SAP. They started with SAP partners to provide collaboration capabilities for SAP customers, leading to superior integration with SAP technologies.
Sending drawings etc to suppliers. Not many companies can help with the engineering collaboration where drawings need to be collaborated with suppliers, providing them a unique value prop.
Limited to European network. Their network is primarily limited to European carriers, which might be limiting for companies seeking to track global supply chains.
Fairly small network limited to European countries. The small network can lead to a biased view of the network, leading to partially completed data that is not as superior as other platforms on this list.
Limited suite and data. The suite capabilities are very limited to a very specific use case, and not a complete suite similar to technologies such as e2open.
8. Elemica
Elemica originated as a carrier and document exchange network, similar to EDI vendors or shipping platforms, with a primary focus on process manufacturers. Since process manufacturers require unique capabilities with document exchange and shipping needs, their network is focused on specific geography, use cases, and industries, limiting their applicability as a true supply chain business network. But they could be a great platform if you are looking to communicate and collaborate with industry-focused trading partners. Given their pros and cons, they rank at #8 on our list.
Pros
SMB friendly. Their platform is very SMB-centric for companies looking for basic communication capabilities within a TMS, especially ideal for companies for which supply chain footprint might be limited because of outsourced supply chains to 3PL and carrier companies.
Connect with carriers, including rate shopping. Allows companies looking for basic carrier communication capabilities, including rate shopping.
Chemical and process industry-specific capabilities. The chemical and process industry is very unique because of its complex inventory and quality requirements, requiring specific capabilities in a network platform.
Cons
Not a real supply chain business network. While a great connectivity platform, it’s not really a real supply chain business network for companies seeking end-to-end traceability and true control tower capabilities.
Really a document exchange and small shipping software. It’s really a very small package for document exchange and shipping needs.
Smaller network footprint concentrated on certain industries. The size of the network is small, limiting its scope as a supply chain business network.
7. True Commerce
True Commerce is primarily an EDI network connecting trading partners in the automotive ecosystem, serving as a visibility platform for the automotive industry. While it could be a great value add for SMBs that might have access to a more robust supply chain platform, it’s not necessarily a true supply chain business network. But it could be a great network if your goal is to primarily connect with trading partners through EDI, ranking at #7 on our list.
Pros
Easy connectivity with trading partners. The main benefit of True Commerce is trading partner communication, with a very lean network for visibility needs.
SMB-friendly. It’s not as cost-prohibitive as other platforms on this list, making it friendlier for SMBs.
Cons
Not a real supply chain business network. While great for connectivity, it’s not a real supply chain platform for companies seeking end-to-end traceability of their supply chain, along with control tower capabilities.
Limited insights and network size. The limited network size would provide biased insights and incomplete data that might not be as valuable for supply chain planning as with other platforms.
6. OpenText
OpenText provides enterprise-grade content exchange and trade document networks primarily for enterprise ERP ecosystems such as SAP or Oracle to provide connectivity with trading partners. With ESG and eInvoicing capabilities housed with these networks as well, their network has been expanded to these workflows, expanding their network further. While it’s a great platform for connectivity and collaboration, it’s not necessarily a true supply chain business network, ranking it as #6 on our rank for this year.
Pros
Best-of-breed content management platform for enterprise workloads. It is one of the leading products for centralized management and distribution of physical document exchange.
A business network for trading partner collaboration. One of the largest networks for trading partner collaboration.
Global compliance. Global compliance capabilities require unique processes for each country and supply chain lanes, providing enterprise-grade compliance capabilities.
Cons
Not a true supply chain visibility platform. While great for execution-centric capabilities with an external network, it’s not a true supply chain platform.
Not friendly for SMBs. The enterprise compliance layers and business rules might be overwhelming for SMBs.
Expensive. SMBs limited on budget and not caring for enterprise capabilities might find it overly expensive.
5. Kinaxis/MPO
Kinaxis, just like e2open, takes a very different approach to its suite and has a true supply chain business network that it owns, enabling the AI and ML workflows crucial for decision-grade data. Their network will provide end-to-end supply chain traceability for all global modes and control tower capabilities. While it might be a great planning suite for manufacturing-centric verticals, as in these industries, planning processes do not need to be tightly integrated with operational workflows, it might not be a great fit for retail-centric verticals as they require planning processes to be tightly integrated with order management, store and floor planning, warehouse, and procurement.
Pros
Planning solutions integrated with the network. Integrated network with the planning solution provides unique capabilities for manufacturing-centric industries.
Complementary capabilities for SAP and Oracle customers. Perhaps one of the best networks along with S&OP platforms for companies already on SAP and Oracle for their ERP.
Decision-grade intelligence. The network provides proprietary data, and because of that, they are able to offer decision-grade data for their planning cycles.
Cons
Not a strong execution component. Their biggest drawback is that they don’t have a strong execution component bundled as part of the suite, but for their industries, the suite might not be as relevant as it is for retail industries.
The network is not as strong as its competitors. The strength of their network might not be as strong as other networks, such as e2open, limiting the quality of decision-grade data.
4. One Network Enterprises
One Network is one of the strongest networks for industry-wide collaboration and control tower capabilities. The network features a strong partner network, providing traceability across geopolitical boundaries using its unique technology capabilities, allowing it to have such traceability. The network is also uniquely positioned for complex scenarios such as counterfeit tracking or global pharma supply chain, making the network more relevant for the execution function than for planning, ranking it at #4 on our list.
Pros
More than 75 companies in the partner network. Their strong partner network provides them with data to provide global supply chain capabilities combining all modes and regions.
Telematics-Enabled Control Tower. The telematics data gathered from across the world help them provide end-to-end traceability that other networks might not have.
Multi-party BOM tracking. This tracking is especially useful for tracking across all stakeholders, providing traceability for pharma or counterfeit.
Cons
Not SMB-friendly. Global traceability might not be as relevant for SMB companies and might be expensive.
Weak planning and execution capabilities. While great with network and global TMS-centric capabilities, other execution components might not be missing for non-transportation or 3PL companies, which might require traceability among trading partners and suppliers, along with an external supply chain.
Limited network. While one of the strongest, the network is not as comprehensive as e2open, making it less reliable for decision-grade data.
3. SupplyOn
Much like OneNetwork and TESISQUARE, SupplyOn centers around procurement and supplier collaboration. While OneNetwork emphasizes global collaboration and industry-wide BOM tracking, SupplyOn, akin to TESISQUARE and Infor Nexus, specializes in procurement and supplier collaboration. It may not delve as deeply into the carrier aspect of the network. Although possessing data from a broader array of companies and countries than OneNetwork, its dataset might not match the completeness of networks like e2open. However, for those focused on procurement and supplier collaboration needs, SupplyOn stands out, earning the #3 spot on our list.
Pros
140 companies from 100 countries. The company and country set is much larger than OneNetwork but might not be as comprehensive as e2open.
Primarily focused on the procurement network and e-invoicing. The focus on the procurement network and e-invoicing would provide much stronger capabilities for this area, although weaker on the carrier side of the network.
Cons
Not SMB-friendly. The platform is not meant to be for SMBs so they will find it expensive.
Weak planning and execution capabilities. While great for the network, it does not have embedded planning or execution capabilities for companies looking for embedded workflows utilizing this data and network, increasing the consulting and implementation budget in using it as part of the architecture, but at the same providing flexibility for the best-of-breed architecture or depart level purchase.
Not as comprehensive as other platforms. The network coverage is not as comprehensive as other platforms on this list due to its primary focus on the supplier collaboration and procurement side of data.
2. Infor Nexus
Infor Nexus primarily serves as a visibility platform, focusing on the procurement and supplier collaboration aspects of the network. It relies on external datasets, such as those from partners like Project44 and FourKites, for carrier-side information. While it excels in meeting the supplier and procurement collaboration needs of verticals like automotive and aerospace, it falls short of providing a comprehensive supply chain business network. Nevertheless, its strength lies in fostering tight collaboration with other architectural layers, such as WMS and ERP, in industries where this collaboration is crucial. As a result, Infor Nexus secures the #2 spot on our list.
Pros
Integrated with Infor solutions such as WMS and ERP. For industries where embedded experience with internal solutions such as WMS or ERP matters, it would provide a tighter experience because of pre-baked integration.
Planning integrated with a network similar to Kinexis. Integrated planning would utilize a proprietary network, a similar strategy as Kinexis for decision-grade data, an architecture strategy relevant for these verticals.
Collaboration and orchestration with global suppliers. Collaboration and orchestration with global suppliers would help with scenarios such as joint planning and forecasting, which are much more relevant for these industries.
Cons
Leaner execution component compared to E2 Open. The execution, especially pertaining to external and global supply chains, would be weaker, requiring external components.
Limited ecosystem. The consulting base and ecosystem might be limited as compared to other options on this list.
1. e2open
e2open stands out as one of the most comprehensive platforms, encompassing a wide range of capabilities within a suite, including planning and execution, coupled with a robust network. In contrast to other solutions that may focus on specific datasets and networks in particular regions, e2open’s network spans suppliers, carriers, and ELD data, covering all modes and geographies. Its versatility shines when managing diverse operations, seamlessly supporting combined business models such as retail and manufacturing under the same portfolio. As a market leader, e2open secures the top spot at #1 on our list.
Pros
The most comprehensive suite combines the power of planning. The most comprehensive suite can work for global and comprehensive business models as complex as retail and manufacturing, especially for business models such as Aftermarket, which are highly complex and combine elements of many industries.
Execution and networks, are adopted by large enterprises. e2open has one of the largest logos on this list and is installed very commonly alongside SAP and Oracle.
Cloud-native UI. Compared to other platforms on this list, e2open has relatively modern technology.
Cons
Expensive. SMBs not caring for external supply chain traceability or decision-grade data might find it expensive.
Not SMB friendly. The enterprise business rules and layers might be overwhelming for SMBs.
+
ERP Implementation Failure Recovery
Learn how Frederick Wildman struggled with Microsoft Dynamics 365 ERP implementation failure even after spending over $5M and what options they had for recovery.
Revolutionizing supply chain planning, industry networks have reshaped the landscape. While you may not directly engage with these networks, comprehending their dynamics is key to evaluating supply chain visibility and platforms touting AI or control tower features. The robustness of their network shapes decision-grade data quality, influencing critical metrics like ETA and demand forecasting, pivotal for operational efficiency and supply chain planning. When evaluating a supply chain platform, delve into the underlying network to gauge the data quality it offers. If navigating this terrain seems daunting, seek guidance from independent supply chain consulting firms to make informed decisions.
FAQs
What are the primary advantages of utilizing supply chain business network platforms in modern industries?
Supply chain business network platforms offer several advantages, including enhanced communication and collaboration among stakeholders, streamlined document exchange processes, improved visibility into supply chain operations, and better compliance with regulatory requirements. These platforms facilitate seamless integration with trading partners, leading to increased efficiency, reduced errors, and ultimately, improved operational performance across the supply chain.
How do supply chain business network platforms contribute to end-to-end traceability and control tower capabilities within supply chain operations?
Supply chain business network platforms play a crucial role in enabling end-to-end traceability and control tower capabilities by consolidating data silos, providing real-time insights into inventory movements, transportation activities, and supplier interactions. Through centralized repositories and advanced analytics, these platforms empower businesses to track products from their origin to destination, identify bottlenecks, mitigate risks, and optimize supply chain processes for better decision-making and operational efficiency.
What factors should companies consider when selecting a supply chain business network platform to suit their specific needs?
When choosing a supply chain business network platform, companies should consider factors such as scalability, flexibility, compatibility with existing systems, geographical coverage, industry-specific functionalities, data security measures, ease of integration, and vendor support services. Additionally, evaluating the platform’s ability to provide end-to-end visibility, support for diverse supply chain processes, and compliance with regulatory standards is essential. By aligning platform capabilities with business objectives and operational requirements, companies can maximize the value derived from their investment in supply chain technology.
Suite roles in architecture hinge on cross-functional embeddedness. Supply chain suites restrict ERP suites to financial reporting, while retail-focused suites demand collaboration with WMS, TMS, and OMS for mature capabilities like inventory management and allocation. These were traditionally considered to naturally reside particularly inside the ERP, sparking debates if hosted elsewhere. In retail, procurement aligns closely with merchandising and planning engines. Conversely, in manufacturing and industrial settings, procurement collaborates more directly with production and accounting, illustrating the diverse nature of suite roles.
In the past, distinctions were blurred, and organizations either didn’t prioritize external supply chain tracking or built custom ERP-based systems for traceability. The evolving landscape of supply chain suites, particularly driven by private equity, has changed this dynamic. Today, previously unattainable possibilities are realized through marketplaces and networks, fostering global insights and collaboration. Technologies like blockchain facilitate seamless global data exchange, transcending international interests. While ESG and e-invoicing are in their infancy, their impact on future architecture remains uncertain. However, it’s likely that a portion of these models will be embedded within the supply chain suite, leveraging networks for collaborative documentation exchange.
As supply chain suites continue to broaden their scope, determining the optimal placement particularly for specific processes within an architecture becomes increasingly complex. While straightforward for pure-play retail or manufacturing models, challenges intensify for businesses with overlapping models, like aftermarket operations blending aspects of both retail and manufacturing. This scenario is particularly applicable to softline and hardline retailers with significant manufacturing exposure. If you’re navigating supply chain suite choices, this list can assist in streamlining your options.
The 2026 Digital Transformation Report
Thinking of embarking on a ERP journey and looking for a digital transformation report? Want to learn the best practices of digital transformation? Then, you have come to the right place.
Dassault Systèmes employs a distinctive approach in its suite, positioned at the crossroads of ERP, CAD, and S&OP. Although tailored for supply chain industries overlapping with process manufacturing and retail, it caters to automotive- and aerospace-centric sectors, necessitating robust supplier collaboration. The suite’s roots lie in plastics, offering integrated tools for plastic-like operations across diverse industries. In contrast, other suites like Blue Yonder may face challenges in these specialized sectors, making Dassault stand out and securing its spot at #10 on our list.
Pros
Integrated with the ERP solution. The biggest plus with Dassault systems is its close alignment with ERP and CAD-centric systems,thus making it ideal for industries heavier on cost tracking, requiring ERP-centric processes, and limiting the role of S&OP to just planning.
Comprehensive suite with PLM/PDM, SCM, and ERP. Integration with PLM and PDM would be friendlier for companies particularly heavier with S&OP processes in their NPD and R&D phases, a critical requirement for process-centric manufacturers.
Compliance pre-baked for automotive and plastic verticals. Compliance processes heavily embedded with supply chain workflows, such as supplier collaboration, would require tight embeddedness of Dassault SCM.
Cons
Technology is not modern. The technology might not be as modern as some of the newer options on this list, such as e2open.
Limited ecosystem. The consulting ecosystem is highly limited, with their reseller channel being heavily crowded with CAD resellers without deeper supply chain expertise.
The network is not part of the suite. They don’t have access to the proprietary network, a critical limitation for demand forecasting, primarily relying on customers’ internal and industry data sources, which are generally substantially off because of inadequacies of their source channels.
9. Trimble
Navigating supply chain planning, particularly in sectors like transportation, construction, and agriculture brings unique hurdles. Transportation prioritizes dispatch and preventive maintenance, influenced by distinctive driver-side compliance processes. Also, agriculture adds seasonal and crop quality factors to the planning mix. In construction, quoting processes wield substantial influence over supply chain planning. Thus, securing the 9th spot on our list, its suite’s specialized approach caters to the demands of these industries.
Pros
A most comprehensive suite containing telematics and fleet management. Most other manufacturing-focused suites might struggle with business models particularly with internal fleets and transportation operations, positioning Trimble uniquely.
Strong in transportation visibility. Their traceability and supply chain equation would be limited to transportation visibility, a strength for transportation-centric industries but a huge limitation for other industries.
3PL-specific planning and data. 3PL-specific planning and data are unique, a limitation with other solutions on this list.
Cons
Not ideal for manufacturing or retail-centric industries. It is not an ideal fit for manufacturing and retail-centric industries, even if they might be using it for the transportation side of the processes.
Primarily focused on transportation execution and compliance. The other execution processes, such as retail, manufacturing, and production, would be highly limiting.
8. QAD
QAD adopts a strategy similar to Dassault’s by integrating CAD/PLM, S&OP, WMS, TMS, and ERP capabilities. Tailored for retail and supply chain-centric industries, it leans towards particularly discrete manufacturing and is less focused on process manufacturing for several industries like automotive and life sciences. QAD’s suite is structured around unique product categories, thus influencing supply chain and production processes across diverse industries. It mirrors the strategies of many supply chain suites, which exclusively focus on the supply chain function, omitting the ERP aspect, therefore making the QAD suite unique. Thus with its distinct attributes, QAD secures the 8th spot on our list.
Pros
Integrated with the ERP solution. The biggest advantage of QAD’s suite is its alignment with ERP-centric processes for cost-focused industries where processes such as cost accounting and production scheduling are critical.
Comprehensive suite with SCM and ERP. It combines the best of both worlds, including most components from the SCM suite, such as WMS and TMS, embedded with ERP processes, as well as CAD and PLM.
Compliance pre-baked for automotive and F&B industries. Compliance processes that require tighter embeddedness with the S&OP processes would find QAD’s suite extremely compelling.
Cons
Backend technology is not modern. The backend technology is not as modern as some of the newer platforms on this list.
Network not part of the suite. QAD would rely on internal and customer-provided external data for its analysis, a substantial limitation compared to other systems owning and maintaining their networks as part of the suite.
7. Manhattan Associates
Manhattan specializes in retail and warehouse execution, tailored for industries tightly integrating physical store planning with warehousing and merchandising processes. These industries, less cost-focused with stable pricing models, don’t demand meticulous cost tracking, as seen in complex industrial sectors. The industries that Manhattan targets adopt a distinctive approach to intricate functions like inventory management, allocation, and omnichannel fulfillment. Its specific applicability to certain industries positions it at the 7th spot on our list.
Pros
Tailored flow for retail merchandisers and planners. Retail merchandising and planning are foundational processes for retailers, collaborating tightly with procurement, new product development, and design teams, requiring unique suites like Manhattan.
Integrated suite, including POS and distributed order management. The POS and DSD-centric business processes require unique architecture, only possible through suites like Manhattan.
Cons
External supply chain planning is limited. The limited focus of Manhattan on retail execution leaves the external supply chain planning outside of the scope of Manhattan.
Network not included. Without a network, the planning components would be dependent upon internal and customer-provided external data, a huge limitation for companies seeking decision-grade data for the entire supply chain.
Körber, akin to Manhattan, adopts a distinct approach with a focus on warehouse and execution components. It caters to 3PL-centric business models, crucial for distribution-focused companies often incorporating 3PL elements. Unlike Manhattan, Körber targets the mid and upper-mid markets, integrating processes like WMS, TMS, and freight claims management. While comprehensive, it lacks certain critical components found in other suites. Its unique approach and more limited applicability position it at the 6th spot on this list.
Pros
Strong warehouse management capabilities. It is one of the strongest cloud-native WMS systems for mid-market companies, covering most aspects of warehouse management relevant to mid-market companies.
TMS capabilities integrated. Industries where the embeddedness of TMS and WMS processes matter, especially for supply chain companies, would find Korber highly attractive.
Strong last mile and parcel capabilities. The last-mile capabilities are uniquely complex because of the scheduling and compliance processes of various industries, making Korber unique for DSD-centric operations.
Network not included. The missing network would not provide the decision-grade data included with other supply chain suites.
No supply chain planning or collaboration. The missing planning or collaboration component might not be the best fit for companies requiring tighter embeddedness of WMS and TMS processes with S&OP.
5. Infor CloudSuite SCM
Similar to Dassault and QAD, Infor CloudSuite SCM adopts a distinctive approach, integrating diverse processes like CAD/PLM, WMS, ERM, and HCM with S&OP processes. It proves ideal for companies with manufacturing-heavy business models where supply chain processes tightly intertwine with new product development and ERP. Pure-play retailers might find other suites more suitable, as S&OP processes may not align with their needs. Given its unique market position, Infor CloudSuite SCM secures the 5th spot on this list.
Great visibility platform with planning. Includes a visibility platform for supplier collaboration and procurement without carrier-focused visibility, generally included in 3PL and retail-centric suites.
Global trade workflows and compliance capabilities. Global trade compliance requires country and geopolitical restrictions that need to be integrated with business processes.
Cons
Weak transportation execution component. Due to the nature of industries Infor CloudSuite SCM targets, the transportation execution component is not as critical for the suite but might be a limitation for diverse operations.
Not proven with enterprise workloads. The enterprises requiring millions of transactions per hour for planning cycles might struggle with it.
Oracle Supply Chain Suite proves ideal for global enterprises with diverse operations and various business models, effectively accommodating the planning cycles of multiple industries. In comparison, industry-specific suites like Infor, QAD, or Trimble may face challenges in handling such diverse operations. Mid-market-focused suites may struggle with the high workload of enterprise-level planning cycles, especially those involving millions of transactions per hour. While limited by its proprietary network, Oracle Supply Chain Suite excels in providing operational capabilities for global enterprises that demand seamless integration across systems such as HCM, ERP, WMS, and TMS with S&OP. Its unique position for large enterprises secures its rank at #4 on our list.
Pros
Comprehensive supply management suite, including global trade management capabilities. The supply chain suite would cover the need for the most diverse operations for global enterprises.
Strong planning platform integrated with execution suite. The planning platform is not industry- or function-specific, providing end-to-end traceability of all planning datasets, including S&OP, human resources, and FP&A.
Pre-integrated with ERP. Embedded processes with ERP, along with a disconnected supply chain suite, can cover both architectures equally well, covering the needs of diverse operations.
Cons
Network not part of the suite. Missing a network would require additional components, and the processes that need to be tightly embedded with the network might struggle.
Not SMB friendly. The enterprise data and process model might be overwhelming for SMBs leaner on their process overhead.
Expensive. Ultra expensive for SMBs looking for cheaper options with learner process and data models.
3. SAP
Like Oracle, SAP Supply Chain Suite is tailored for global enterprises with diverse operations, accommodating planning cycles across various business models. Unlike Oracle, SAP offers friendliness for product-centric industries deeply involved in cost accounting and MRP-driven processes. Mid-market-focused suites may struggle with the high workload of enterprise-level planning cycles, dealing with millions of transactions per hour. Despite its proprietary network limitations, SAP Supply Chain Suite excels in providing operational capabilities for global enterprises, seamlessly integrating systems such as ERP, WMS, HCM, and TMS with S&OP. This unique position earns it the #3 rank on our list.
Pros
Comprehensive supply management suite, including global trade management capabilities. The supply chain suite is comprehensive for highly regulated organizations requiring process tightness and control across systems such as ERP, WMS, TMS, and S&OP.
Strong planning platform integrated with execution suite. The tight integration of the planning suite with execution components allows cross-pollination of business rules, which is highly critical for publicly traded organizations.
Pre-integrated with ERP. The pre-integration with ERP allows exploring diverse warehouse architectures – decoupled or embedded, catering to different business models, being especially friendly for 3PL-centric operations.
Cons
Network not part of the suite. The missing network would struggle with the cross-pollination of business rules, requiring a network.
Not SMB friendly. The overbloated enterprise data and process layers would be overwhelming for SMB companies.
Blue Yonder stands out as a unique suite, akin to Manhattan, offering retail-centric capabilities enriched with robust external supply chain processes and control tower capabilities. In contrast to industry-specific suites like QAD, Infor Nexus, and Dassault, Blue Yonder may not excel in industries requiring seamless integration of business rules from WMS, TMS, and OMS with ERP, particularly those emphasizing cost accounting and MRP-centric processes. Unlike SAP and Oracle, which may lack depth in external supply chain capabilities, Blue Yonder proves more suitable for industries necessitating the decoupling of cost-centric overhead. Differing from e2open, Blue Yonder lacks its proprietary network. Its versatile application across various industries earns it the #2 spot on our list.
Pros
Strongest supply chain suite with planning and execution components. One of the strongest pure-play supply chain suites for retail-centric industries.
Ability to handle a large number of SKUs for enterprise retailers. Enterprise retail workloads require processing millions of transactions per hour for planning loads containing millions of SKUs and location planning.
External supply chain capabilities. One of the strongest supply chain suites for end-to-end supply chain traceability, internal or external.
Cons
ERP is not included as part of the suite. In the processes and business models where cross-pollinations of business rules with ERP is critical, Blue Yonder might not be the best fit.
Network is not part of the suite. With Blue Yonder not owning its own network, it might not have as much control over the third parties providing them network.
Not SMB friendly. The enterprise process and data layers might be overwhelming for SMBs.
1. e2open
e2open takes a unique approach to its suite, straddling the realms of retail and manufacturing and integrating transactional CRM processes. Diverging from Blue Yonder, e2open prides itself on its proprietary network, ensuring precise decision-grade data, a valuable asset for companies contending with demand forecasting challenges and data dependencies on external factors. While exhibiting similarities with QAD or Infor Nexus in various capacities, e2open encounters constraints in architectures necessitating ERP cross-pollination for specific industries. In such contexts, e2open may not be the optimal choice. Nonetheless, its robust enterprise-grade capabilities and deep supply chain processes catapult it to the forefront, securing the coveted #1 rank on our list.
Channel marketing planning and collaboration. One of the unique aspects of e2open is that it has a process for channel-driven organizations with trade rebate planning and several other processes that are relevant for collaborative channels.
Global compliance and e-invoicing support. Along with the capabilities that most suites offer, it also has capabilities for global compliance and e-invoicing support, requiring only one platform for all collaboration and joint planning needs.
Cons
ERP is not included as part of the suite. For industries where planning processes might require cross-pollination with ERP processes, e2open might not be the best fit.
Limited ecosystem. The consulting ecosystem is not as prevalent as some of the other solutions on this list, so finding talent might be harder with e2open.
+
ERP Implementation Failure Recovery
Learn how Frederick Wildman struggled with Microsoft Dynamics 365 ERP implementation failure even after spending over $5M and what options they had for recovery.
Supply chain suites have diverse origins, evolving from various perspectives—some rooted in execution systems, others in planning. Over time, they’ve developed significant overlaps with each other and other enterprise software categories, intensifying architectural challenges. In your quest for a supply chain suite, delineate your business process boundaries and determine their natural placement based on required process embeddedness. This list aims to streamline your options, yet identifying the right suite demands expertise, often provided by independent ERP consultants.
FAQs
What distinguishes supply chain suites from traditional ERP suites?
Supply chain suites are tailored to manage complex supply chain operations, including procurement, production planning, inventory management, logistics, and distribution. Unlike traditional ERP suites, supply chain suites focus on cross-functional embeddedness, restricting ERP suites primarily to financial reporting. Additionally, supply chain suites often demand collaboration with various systems like WMS, TMS, and OMS for mature capabilities such as inventory management and allocation.
How do supply chain suites cater to different industries?
The roles of supply chain suites vary across industries. For example, in retail, procurement closely aligns with merchandising and planning engines, while in manufacturing and industrial settings, procurement collaborates more directly with production and accounting. These differences illustrate the diverse nature of suite roles, highlighting the need for tailored solutions to meet industry-specific requirements.
How do supply chain suites incorporate emerging technologies like blockchain and ESG considerations?
Supply chain suites are evolving to incorporate emerging technologies like blockchain for seamless global data exchange and ESG (Environmental, Social, and Governance) considerations. While the impact of these technologies on future architecture remains uncertain, it’s likely that a portion of these models will be embedded within the supply chain suite, leveraging networks for collaborative documentation exchange. As the landscape continues to evolve, supply chain suites will adapt to integrate these technologies to meet industry demands and regulatory requirements.
Running inventory-centric operations without an S&OP system is nearly impractical. Traditionally, businesses managed operations through complex spreadsheets, merging data from various sources. Despite ERP systems claiming S&OP capabilities, their rigid data structures for transactions hinder analytical workflows. An alternative system with a more flexible structure is needed, one that allows easy manipulation without disrupting core operations.
Tailoring data layers to analytical needs involves flattening and augmenting data based on organizational requirements and speed of insights. Analytical systems, unlike core operational data systems, have a lower impact from changes, such as SKU and BOM structure modifications. External changes may still necessitate adjustments to the data model for accurate correlation and association, ensuring the generation of necessary KPIs and insights for the organization.
The design of S&OP systems is influenced by various factors, with some systems integrating other suites like WMS, TMS, or OMS based on tight analytical workflows and operational requirements. Retail industries, for instance, may require collaboration between merchandising, planning, procurement, and R&D teams, prompting the inclusion of these processes within the S&OP system suite. Corporate strategy and transactional alignment play a crucial role in determining the suitable architecture, emphasizing the need for an S&OP system tailored to unique workflows. Ready to explore the top S&OP systems in 2024? Let’s delve in.
The 2026 Digital Transformation Report
Thinking of embarking on a ERP journey and looking for a digital transformation report? Want to learn the best practices of digital transformation? Then, you have come to the right place.
While various systems cater to different industries, S&OP systems necessitate industry-specific capabilities. In retail, planning varies even between softline and hardline operations. Relex excels in mid-market retail, providing pre-configured workflows for streamlined implementation. Unique features like retail floor planning and planogram optimization, common in larger supply chain suites, make Relex a robust choice for retail operations without displacing existing operational systems like WMS or TMS. Despite requiring closer integration with operational processes, Relex secures its position at #10 on our list.
Pros
Integrated workforce planning. While smaller systems might require an external system for workforce planning,Relex can combine workforce planning as well, making a comprehensive planning engineer combining floor space planning or workforce.
Strong retail planning solutions such as pricing and promotions. The other solutions on this list might not have retail-specific capabilities such as pricing and promotions, requiring substantial efforts to implement them.
Cons
Limited focus. The limited focus on retail might be irrelevant for companies centralizing their analytical processes and data siloes. Equally limited for diverse operations.
Not an integrated suite. Unlike other supply chain suites that are likely to be pre-integrated, Relex might require substantial master data and consulting expertise if the analytical processes need to be tightly embedded with operational processes.
Not meant to be for enterprise workloads. While a great mid-market solution, it’s not ideal for enterprise-level workloads with millions of SKU and location planning requirements.
9. Oracle Demantra
Much like SAP IBP, Oracle Demantra suits companies already using Oracle for various technologies like TMS, WMS, or ERP. Offering seamless integration for analytical processes closely tied to operational workflows, it proves beneficial for diverse businesses seeking robust S&OP capabilities. Particularly suitable for those with substantial implementation budgets to customize industry-specific processes, Oracle Demantra stands out as an excellent choice for large enterprises already integrated with Oracle retail solutions or ERP, securing its position at #9 on our list.
Pros
Designed for enterprise planning workloads. Oracle Demanta is proven for large enterprise workloads where companies may have millions of SKU and location permutations and combinations.
Comprehensive demand forecasting capabilities. While other products may not have as robust demand forecasting capabilities, especially containing enterprise-grade strategies and formulas built, Oracle Demantra has deep capabilities.
Pre-integrated with other Oracle products. The pre-integrated workflows would reduce the consulting and integration time. But don’t forget to vet if the existing integration is good enough for your use case.
Cons
User interface might be clunky. The user interface is not as modern as other modern options, leading to adoption issues among users.
Steep learning curve. The enterprise-grade layers and data model would require substantial learning without prior experience with the product.
Much like Oracle Demantra, SAP IBP caters well to businesses already utilizing SAP for various technologies like TMS, WMS, or ERP. Offering seamless integration for analytical processes closely tied to operational workflows, it proves beneficial for diverse enterprises seeking robust S&OP capabilities. Particularly suitable for those with substantial implementation budgets to customize industry-specific processes, SAP IBP stands out as an excellent choice for large enterprises already integrated with SAP S/4 HANA, earning it the #8 spot on our list.
Comprehensive supply chain planning capabilities. While other solutions might be limited in their capabilities, SAP IBP covers broad capabilities for a variety of industries.
Designed for enterprise workloads. Proven for very large workloads with millions of SKU and location combinations and parallel workflows for enterprise-wide planning workloads.
Cons
Dated user interface. The user interface might not be as modern as some of the other cloud-native platforms.
Expensive. SMBs not caring for enterprise capabilities might find it expensive.
7. e2open
e2open stands out as a holistic suite encompassing supply chain aspects like network, planning, and execution. Its strength lies in the robustness of its network, setting it apart from other platforms. Beyond technical capabilities, e2open excels in delivering vital industrial data, enhancing essential KPIs such as demand forecasting and arrival times. Ideal for businesses seeking a comprehensive suite with S&OP capabilities, e2open secures its position at #7 on our list.
Pros
End-to-end Supply chain capabilities are part of the suite. e2open is perhaps the most comprehensive supply chain suite capable of building industry-wide supply chain planning workloads because of its network and access to industry data.
Richest decision-grade data through its network. The quality of decision-grade data is completely dependent upon the amount and the quality of data available, making it one of the highest quality data crucial for S&OP planning.
Collaboration planning is easy if customers and supplies are already part of the network. The biggest advantage of e2open is the network effect that you have, especially if both suppliers and customers are likely to be part of the same network.
Cons
Expensive. SMBs not caring for enterprise-grade capabilities or networks might find its hefty price tag unnecessarily expensive.
Learning curve. Due to the connected datasets with other execution capabilities, substantial consulting help with data modeling and implementation will be required.
Operating primarily in the prescriptive category, much like Relex, Logility caters to mid-market companies in specific industries. As a standalone S&OP system, Logility doesn’t necessitate the replacement of other transactional or operational components, allowing department-level implementation. The simplicity of data modeling and implementation is an advantage, given its independence from other suite components. However, incorporating Logility into the architecture may demand extensive enterprise architecture expertise for master data governance and integration workflows. Positioned at #6, Logility stands as a compelling prescriptive standalone solution for the mid-market.
Pros
Standalone planning solutions. The standalone nature makes it easier to implement and use at the departmental level without requiring as much consensus with the other departments.
Planning scenarios built up. The planning scenarios are built up, reducing consulting in building workflows from scratch but increasing training and adoption in learning the proprietary knowledge of the platform.
Detailed inventory planning. Comprehensive inventory planning pre-built, requiring substantial consulting expertise to enable the same capabilities on the other platforms.
Cons
Not designed for enterprises. Logility is not proven for enterprise-grade workloads, requiring planning for millions of SKUs and location combinations.
Limiting flexibility. Prescriptive workflows and proprietary knowledge may lack the flexibility analysts enjoy with spreadsheets or other technical platforms.
5. OMP
OMP follows a prescriptive approach similar to Relex or Logility, offering a distinctive solution tailored for industries with intricate inventories like chemicals, life sciences, and metal. Due to the unique planning cycles and data models necessary for these industries, OMP stands out, rendering other industry-agnostic solutions less relevant. However, its industry-specific focus may pose a challenge for businesses spanning diverse sectors. Positioned at #5, OMP emerges as a robust solution for mid-market companies with budget constraints seeking a prescriptive solution.
Pros
Strong in life sciences and metal-oriented inventory planning. These industries have unique requirements to support complex attributes and lot and serial numbers, making them slightly difficult in vanilla platforms if they are not designed for those industries.
Friendlier for Mid-market because of pre-baked functionality. The pre-baked functionality and prescriptive workflows would reduce the consulting costs but increase training time to learn proprietary knowledge.
Cons
Highly technical and would require significant consulting support. The prescriptive nature would require substantial consulting efforts in learning proprietary knowledge and translating current data models to platform data models.
Not designed for enterprise workloads. It might not be the best fit for enterprises planning for millions of SKUs and location combinations, which might be even harder for these industries as the planning may need to be done at the lot or serial number level.
Not the best fit for diverse operations. The focused nature may not be the best fit for companies seeking to manage diverse planning models on the same platform.
4. O9 Solutions
In the competitive landscape alongside enterprise-grade platforms like Blue Yonder and Anaplan, O9 emerges as a top choice for upper mid-market to enterprise companies. It caters to those seeking extensive technical capabilities for enterprise-wide planning, particularly within retail-centric industries. Many mid-market or outdated enterprise solutions may lag in technology investment, lacking advancements in AI and ML crucial for effective S&OP systems. Despite offering enterprise-level capabilities, o9 is not an exhaustive supply chain suite, enhancing ease of implementation at the department level. This position is o9 at #8 on our list.
Pros
Advanced AI and ML capabilities. The enterprise-grade AI and ML are likely to be similar to Blue Yonder or e2open, with the only exception being the included network.
Pre-built planning workflows tailored to specific industries, such as retail. The pre-built and prescriptive workflows would not require as much consulting effort as it would with other vanilla solutions such as Anaplan.
The well-adopted solution in various in large enterprises. The O9 solution is well-proven with very large enterprise logos, which are very similar to Blue Yonder or e2open.
Cons
Not the best fit for smaller businesses. The enterprise layers and consulting expertise required to implement and learn o9 might be overwhelming for SMB companies.
Ecosystem. The ecosystem does not have as many consulting companies as it might be available for other leading platforms such as Anaplan.
3. Anaplan
Anaplan stands out as a highly sophisticated platform catering to enterprise-wide connected planning across FP&A, S&OP, and more. Unlike some prescriptive solutions, Anaplan minimizes the need for industry-specific proprietary knowledge. While its planning models may not match the scalability of Anaplan, it appeals to skilled planners accustomed to extensive spreadsheet use due to its flexible platform. However, leveraging Anaplan may entail a substantial consulting budget for workflows that could be pre-configured in other solutions. Positioned at #3 on our list, Anaplan is a prime choice for enterprises seeking scalable, connected planning without additional platforms.
Pros
Highly customizable for sophisticated planning scenarios. The planning models can accommodate diverse planning models across industries rather than being limited to just one function or industry.
Connected planning, including all planning datasets. Most other focused solutions, such as Relex, Logility, and o9, are likely to require another planning solution. Even the enterprise-grade supply chain suite would crate disconnected planning experience as FP&A and human resources planning are likely to be disconnected with them, making it one of the best candidate planning use cases despite missing the supply chain suite.
Ecosystem. Anaplan has one of the most mature consulting bases compared to all other solutions on this list.
Requires consulting support. The technical platform would require building the business workflows and reports that might already be pre-built with several solutions on this list.
Limited pre-baked industry-specific workflows. Limited pre-baked industry-specific workflows would require substantial help from consulting companies with expertise in building industry-specific planning models.
2. Blue Yonder
Similar to e2open, Blue Yonder offers a comprehensive suite encompassing various supply chain components such as WMS, TMS, and S&OP. Contrasting with e2open, Blue Yonder relies on partners for its network needs instead of having its proprietary network. Although it lacks a proprietary network, Blue Yonder excels in handling enterprise workloads, particularly in the retail sector. Comparing it with a few others, Blue Yonder and Anaplan take divergent approaches to their suites. Anaplan prioritizes connectivity and traceability in planning, whereas Blue Yonder excels when S&OP processes demand tighter embeddedness with operational processes. Positioned at #2 on our list, Blue Yonder proves to be an excellent S&OP system for enterprises seeking a comprehensive suite.
Most tools are part of the suite for retail planners and merchandisers. Retail industries would find Blue Yonder most relatable as most tools related to retail planning are part of the suite, allowing everyone to operate seamlessly on the same data.
Ecosystem. Blue Yonder is widely popular among large consulting firms, allowing customers to find talent easily.
Cons
Expensive. SMB companies not caring for enterprise-grade capabilities might find Blue Yonder unnecessarily expensive.
Not the best fit for 3PL companies. Designed from the perspective of retail companies, it’s not as suitable for companies with 3PL as part of their business model as their planning cycles are uniquely different from retailers.
1. Kinaxis
Compared to other prescriptive options such as Logility or O9, Kinaxis is perhaps the ideal solution, covering many different market segments. Although it doesn’t have the same suite capabilities as Blue Yonder, it also makes it slightly friendlier for companies looking for a standalone S&OP system without requiring alignment with other departments. Like e2open, Kinaxis is perhaps the only other solution that owns a network, providing superior decision-grade data than other platforms. Contrasting with Anaplan, it would not require as much consulting help, especially for manufacturing companies, for which supply chain planning is far more detailed and different. Kinaxis is one of the most versatile options catering to many companies, making it the #1 option on this list.
Pros
Richest pre-baked planning platform with enterprise-grade capabilities for manufacturers and retailers. Manufacturing planning requires traceability and planning at the BOM level, which are very similar capabilities to MRP, requiring far more firepower than for industries planning at the SKU and location level.
Advanced capabilities such as returns and spare parts management. Pre-built return and spare parts management capabilities would not require as much consulting help as building these capabilities on a vanilla platform would.
Proprietary Network. Kinaxis is perhaps one of the few platforms on this list that owns its own network, providing superior decision-grade data than other platforms.
Cons
It may not be the most customizable platform. The prescriptive nature of the platform for analysts seeking a flexible platform to build capabilities atop the vanilla platform.
Expensive. SMBs looking for simpler solutions without enterprise-grade capabilities and layers might find it expensive.
Learn how Frederick Wildman struggled with Microsoft Dynamics 365 ERP implementation failure even after spending over $5M and what options they had for recovery.
Navigating the myriad S&OP systems can feel like solving a puzzle, with each platform adopting a unique approach tailored to traceability and connectivity goals. Industry considerations, including planning cycle nuances, further influence the suitability of each solution. As you contemplate an S&OP system, articulate its scope and collaboration with enterprise data. This clarity aids in selecting the optimal option from the provided list. If this task exceeds your expertise, seeking guidance from independent ERP consultants can be invaluable.
FAQs
Why is running inventory-centric operations without an S&OP system nearly impractical?
Managing inventory effectively requires aligning sales forecasts with production plans, a task nearly impossible without an S&OP system. Traditional methods using complex spreadsheets lack the flexibility and efficiency needed in today’s dynamic business environment.
What factors influence the design of S&OP systems?
Several factors influence the design of S&OP systems, including industry-specific requirements, integration with other operational suites like WMS or ERP, and the need for collaborative planning among various departments such as merchandising, procurement, and R&D.
How can businesses tailor data layers to their analytical needs in S&OP systems?
Tailoring data layers involves flattening and augmenting data based on organizational requirements and the speed of insights needed. This process allows for easier manipulation without disrupting core operations and ensures accurate correlation and association for generating necessary KPIs and insights.
Enterprises undertake a myriad of projects, each presenting distinctive characteristics—internal or external, short or long-term, billable or cost-centric, and varying across industries with specific scheduling and reporting needs. Construction projects diverge substantially from software development endeavors. Each falls under the umbrella of project management, necessitating diverse processes and unique capabilities from project management systems. How do you navigate this complexity effectively?
The architecture of project management systems is also intricately shaped by their capabilities overlapping with other adjacent systems. Being part of an ERP system requires alignment with accounting and procurement, driven by workflow needs and the balance of front-end and back-end processes. Additionally, potential overlaps with CRM processes may arise, particularly when sales and project management are closely linked, necessitating smooth data exchange. In certain industries, where project management systems integrate billing, scheduling, invoicing, and finance extensively, it is termed a PSA, prevalent in professional services. PSA shares design principles similar to project management but encompass broader capabilities than standard project management systems.
Project management systems exhibit diversity, yet common elements prevail, reflecting the fundamental components of any project. Projects inherently involve start and end dates, tasks, activities, and the allocation of resources and materials. Correspondingly, project management systems incorporate these essentials, providing features like task scheduling for designated resources to facilitate capacity planning and service delivery. Analyzing your project scope and conducting a gap analysis with a project management software data model will guide you to a fitting solution. Ready to discover the top 10 project management software options for 2024? Let’s explore the details.
The 2026 Digital Transformation Report
Thinking of embarking on a ERP journey and looking for a digital transformation report? Want to learn the best practices of digital transformation? Then, you have come to the right place.
Definition of a project management system. A siloed system that can be acquired and implemented without dependencies on cross-functional workflows.
Overall market share/# of customers. The higher the market share, the higher it ranks on our list.
Ownership/funding. Superior financial standing and funding by private equity or corporate investors rank higher on our list.
Quality of development. The more cloud-native capabilities, the higher it ranks on our list.
Community/Ecosystem. The larger the community, the higher it ranks on our list.
Depth of native functionality for specific industries. The deeper the publisher-owned out-of-the-box functionality, the higher it ranks on our list.
Quality of publicly available product documentation. The poorer the product documentation, the lower it ranks on our list.
Project management system market share. The higher the marketshare as a project management solution, the higher it ranks on our list.
Ability to natively support diversified business models. The more diverse the product, the higher it ranks on our list.
Acquisition strategy aligned with this product. The more aligned the acquisitions are with the product, the higher it ranks on our list.
User Reviews. The deeper the reviews with pros and cons, the higher the score for a specific product.
It must be a project management system: it can’t be a project management module of an ERP. It must be a standalone project management software that can be acquired by the line of business or department without aligning with other departments.
10. Workzone
Initially crafted with ad agencies and marketing firms in mind, Workzone shares similarities with software designed for software development companies. Primarily adept at handling internal projects and workflow components, it encompasses technical and operational features but may lack robust financial capabilities for aspects like invoicing, billing, resource budget planning, and project finance. Another potential drawback is its technology, which may not be as modern as the alternatives on the list. Despite these limitations, Workzone holds a significant market share in its industry verticals, earning it a spot as the 10th choice on our list of project management options.
Set permission levels by project and document. The permission level could be another area, generally leaner in smaller packages, relatively detailed with Workzone.
Project templates. Most project management software might have template capabilities but fewer pre-built, which is not a limitation with Workzone.
Cons
UX is not as modern as other options on this list, such as Wrike. Their technology might not be as modern as other leading options, making the UX slightly inferior to other products.
Batch features such as editing multiple tasks at once might be limiting. Limited batch features might require additional clicks, driving operational inefficiencies.
Limited workflow capabilities for each individual user. The limited workflow capabilities may lead to overbloated screens and features for users, causing adoption issues.
9. ClickUp
Much like Workzone, ClickUp was initially tailored for remote work and agile development teams. While there are some similarities, the unique requirements of Agile and remote teams set them apart significantly from traditional project management, making ClickUp less suitable for other industries. While an excellent choice for software development or marketing firms, it may not be the ideal fit for professional services or construction-centric companies. Considering its strengths and limitations, ClickUp secures the 9th position on our list.
Pros
Designed for software development and agile teams and primarily for internal projects. Companies caring for agile-centric capabilities might struggle to relate to the product.
Responsive customer support. The other products in this segment will have limited support from external consulting firms, and because of their missing channel, having good support from the provider is a huge advantage.
Automation of administrative tasks. Automation of tasks will help maintain data integrity, offering analytical workflows without manual inputs.
Cons
Billing and project costing could be a challenge. Companies seeking PSA capabilities or client-centric workflows might struggle with the product, requiring manual overhead for billing and invoicing.
Using nested formulas may be a challenge. The flexibility offered by other project management tools, through their formula capabilities, to track dependencies for complex projects, such as Microsoft projects, might not be as detailed.
Batch tasks such as bulk user management and CSV capabilities. The limited bulk user management and CSV capabilities might be operationally inefficient for larger teams and complex projects.
8. Jira
Jira stands out as a popular choice among software development firms, largely due to its parent company’s suite offering bug tracking and integration with version management software. However, these capabilities may not be as relevant for other professional companies that prioritize critical functions like billing and invoicing. Despite its widespread use, Jira’s strengths lie primarily in the software development and technology sectors, supported by a dynamic marketplace. Its applicability beyond these domains is limited, leading it to secure the 8th position on our list.
Pros
Requirements management and bug tracking are integrated in one place. The tight integration of project management with requirements management and the intertwined nature of bug tracking with Kanban processes is a huge plus for software development companies.
Perhaps the best tool for Agile software development and internal project tracking. Due to the unique process of agile development, even the tools designed for marketing agencies might fall short.
Requirements, QA, and project management teams can all work together with complete traceability from release, sprint, epics, and user stories. This traceability is a unique requirement for software development because of the unique requirements of diverse teams.
Cons
Time tracking may require an add-on. Time tracking is not out-of-the-box, a key input for companies caring for project costing and financials.
Might not be the best fit for client-focused project management where the hours need to be billed, and the costs of the projects need to be measured. Industries such as professional services such as accounting legal practices.
Airtable belongs to the emerging category of project management tools alongside Monday.com and SmartSheet. These tools, essentially workflow management software, serve diverse needs and function as technical frameworks for various use cases, including project management and CRM. Their flexibility proves advantageous for industries with custom and evolving workflows, like financial services, non-profit organizations, or membership-based entities. However, deploying these tools may necessitate extensive consulting and custom development, potentially leading to over-engineering processes. Tight business rules and data integrity, common in more mature software, may be lacking. Despite their adaptability, these tools secure the 7th position on our list.
Pros
Graphic design, integration with 3D models, etc for engineering teams. Airtable’s unique capabilities and integration with graphic design and 3D engineering software make them uniquely suitable for marketing agencies, event management, and architectural and engineering firms.
Integration and ecosystem. The biggest advantage of Airtable is the number of integrations available and companies consulting in its ecosystem, augmenting core capabilities.
Designed for custom workflows. Companies with custom workflows require substantial flexibility with the data model and the ability to create data-gathering forms for ongoing needs.
Cons
Workflow and notifications might not be as advanced as Monday.com. The workflows and notifications are far more developed with other options, such as Monday.com.
The interface is not as intuitive as Monday.com. The richer layers providing advanced capabilities might require consulting and training help for users to effectively use the software.
Project costing and billing may require consulting hours to get it right. Mature capabilities such as project costing and billing might require expert consulting help, driving implementation budget, and cheaper with other pre-baked platforms.
6. Monday.com
Monday.com presents a comparable alternative to Airtable, differing subtly in its pricing model and industry alignment. Like Airtable, Monday.com is exceptionally well-suited for industries relying on custom workflows, particularly in workflow management scenarios where external collaboration holds equal importance to internal collaboration, resembling use cases found in surveys or customer experience software. However, similar to Airtable, the main drawback of Monday.com lies in its need for consulting assistance to implement more advanced business capabilities, which are pre-built in other options on this list. Despite this limitation, it secures the 6th position on our list.
Pros
Best for industries with custom workflows. The industries with custom workflows would find other smaller packages, flavored for specific business models and industries, constraining.
Industry-specific variations and templates. While the core packages might not provide core capabilities, the marketplace offers industry-specific templates and variations, augmenting core capabilities.
Clean user interface. The user interface is one of the cleanest, providing a nice balance of spreadsheet-like views and forms, along with the flexibility to switch to different perspectives.
Cons
Project costing and billing might require significant expertise and consulting efforts. Companies needing critical financial capabilities embedded with projects would struggle the most, requiring consulting help to be successful.
Gantt charts are exported as PDFs, which may be difficult to use in other applications. Complex projects are likely to require compatibility with external software, especially if external teams might collaborate on the projects, making PDF-centric exports restricting.
Tasks cannot be linked across boards. The data model is not as linked, creating issues while linking different boards where dependencies might be across the projects among projects or across portfolios.
5. SmartSheet
SmartSheet, similar to Monday.com and Airtable, despite UX not being as compelling as its rivals, is likely to have friendlier capabilities for traditional project managers, similar to Microsoft Project. It combines features similar to Monday.com and Airtable with the ability to create quick boards and Kanban queues along with the calendar view for easy scheduling. It also allows features such as easier workflow management for users, enabling them to enter their time, which will be recorded and accounted for on projects without much operational overhead. However, mature capabilities such as billing and invoicing, etc., would require substantial consulting help or an add-on on top of SmartSheet.
Pros
Spreadsheet look, loved by project managers. The biggest plus of SmartSheet is the familiar spreadsheet and MS project look, providing an easier transition for users.
Customizable automation is easy to use. Customizable automation does not require as much technical expertise, making it easier for business users to easily customize the workflows for their use.
Users can instantly toggle between various project views. The ability to switch between different views increases adoption among users with different preferences.
Cons
Billing. Implementing mature features available with a PSA, such as billing, would require substantial consulting help while still causing scalability issues.
Performance with larger sheets. Complex projects with larger sheets might experience performance bottlenecks, slowing them down.
4. Asana
Asana stands out as the market leader, boasting a data and process model that is particularly accommodating for marketing agencies. While it delivers fundamental project management capabilities, especially for non-billable operations, it may not offer the same seamless experience found in workflow management platforms like Monday.com or Airtable, which are designed for companies with customized project management workflows. Despite its rich ecosystem, professional services firms in areas such as accounting or legal may find it less relatable. Nevertheless, its market strength earns it the 4th position on our list.
Integrations and ecosystem. The integration and ecosystem are likely to be friendly for marketing and creative agencies, with the possibility of pre-baked integrations working as is without increasing the consulting budget with custom integration.
Track bugs, manage sprints, and plan and run campaigns, events, and product launches. Similar to Jira, it has several features that are uniquely applicable to software development firms and marketing agencies, which is where it is predominantly used.
Cons
Primarily for internal project management. Without the PSA capabilities pre-built, it’s meant to be for internal project management, primarily focusing on the operational aspect of project management and not financial.
Other industries that are not software or marketing might not be able to relate to it. The industries with substantial divergence from software development or marketing agencies might not be able to relate to it.
Kantata, a market leader, caters to companies requiring mature PSA capabilities. Its offerings include workflows like skill-based scheduling, capacity planning, and intricate milestones and billing processes. Kantata boasts two products—one tailored for a native Salesforce experience and the other for an external cloud-native experience akin to Wrike. However, it’s worth noting that Kantata may not be the best fit for smaller companies due to user limits and its higher cost. Nevertheless, for Salesforce users seeking comprehensive capabilities, it secures the 3rd position on our list.
Pros
Milestone tracking, billing, and skill-based resource scheduling. Companies with complex project milestones, especially contingent on client billing, would find Kantata especially friendly.
Native Salesforce and non-native experience are available through SX and OX platforms. Different options for native salesforce experience or non-native makes provide flexibility with users’ preferences for the right interface.
Enterprise-grade PSA functionality for companies that don’t prefer integrated accounting and GL bloatedness of ERP systems. The integrated features of ERP would require corporate alignment with accounting and procurement functions.
Cons
Minimum 30 users requirement. The user requirement makes it unfriendly for companies with smaller teams with fewer billable resources.
Might be difficult to use for smaller companies. Smaller companies with resources that are not as digitally savvy and not versed in business transactions with milestone billing might find it overwhelming.
It would require expensive consulting services to set it up. The complex data model and workflows would require substantial consulting help to be successful with the product.
2. Wrike
Wrike, positioned in the prescriptive cloud-native category and primarily crafted for internal project management, stands out as an ideal choice for companies seeking versatile project management capabilities. In contrast to Jira and Asana which might have better integration for requirement management or bug tracking, Wrike exhibits superior integration and ecosystem, particularly in time management. Its robust data model surpasses that of smaller project management software, offering detailed capabilities for project portfolio management and sub-projects. Drawing the closest comparison to Asana in terms of strategy and design, Wrike secures the 2nd position on our list.
Pros
Comprehensive project management with a focus on transparency and tracking. Ideal for companies seeking pre-baked project management capabilities without much consulting help.
Project and team organization can be easily customized to meet teams’ needs. The project structure is fluid enough to accommodate the needs of most projects.
Security and granular permission needs. Unlike smaller packages, which might not have as detailed security and workflow capabilities such as enabling task administration for specific users or having multiple moderators, Wrike’s security architecture is not as limited.
Cons
Designed for internal project management. The external project management capabilities often found in a fully-baked PSA would be limited, making it less relevant for professional services companies.
Client billing and invoicing would be a disconnected experience. The layers required for client billing and invoicing would require ad-hoc arrangements or manual processes.
Positioned as the most balanced choice, Teamwork caters to client-centric professional services seamlessly integrating project delivery capabilities. Diverging from slightly flexible alternatives like Monday.com or Airtable, Teamwork adopts a prescriptive strategy akin to Wrike. Its advantageous alignment with the HubSpot ecosystem enhances its appeal. Notably, Teamwork excels in PSA capabilities, mirroring those of Kantana, and remains accessible for smaller businesses, earning it the top spot on our list.
Pros
Client invoicing, project, and timesheet management in one place. This is highly beneficial for companies with billable processes and projects, with operational workflows intertwined with financial such as billing and invoicing.
Easier to track project costs and track utilization. Very few options on this list combine both operational and financial aspects of project management. Teamwork is one of them.
Unlimited client collaboration users with paid plans. While the data and process model is not as flexible, it would allow client collaboration just as with Monday.com or Airtable.
Cons
It might have a steeper learning curve for teams not familiar with the setup. The prescriptive data and process model might have a steep learning curve for skillsets not familiar with the upkeep of relational data models.
The integration options and ecosystem might not be as developed as some other options on this list. The integration and ecosystem might not be as developed as other options on this list, such as Asana or Monday.com etc.
It might be more expensive per user than the other options. The pre-baked functionality provided as part of the software would require a higher licensing fee compared to other options on this list.
+
ERP Implementation Failure Recovery
Learn how Frederick Wildman struggled with Microsoft Dynamics 365 ERP implementation failure even after spending over $5M and what options they had for recovery.
The project management category may appear entwined with ERP or CRM, yet companies emphasizing internal project management workflows may find integrated solutions overly complex. The inclusion of accounting and procurement workflows could prove cumbersome, especially for companies not caring for cross-functional processes like cost accounting.
Deciding between standalone project management systems and integrated solutions hinges on corporate strategy and enterprise alignment. If you’re seeking standalone options, this list offers potential choices. However, extracting maximum business value from project management software demands expertise—an area where an independent ERP consultant can provide invaluable guidance.
FAQs
How can project management systems enhance collaboration within teams?
Project management systems enhance collaboration by providing centralized communication, task assignment, and tracking, file sharing with version control, calendar integration, and visibility into project progress.
How do I determine which project management system is best suited for my industry?
Determining the best project management system for your industry involves analyzing the specific requirements and workflows prevalent in your sector. Consider factors such as whether the system offers industry-specific functionalities, integrates seamlessly with other tools commonly used in your industry, and has a track record of successful implementations in similar organizations. Additionally, look for user reviews and case studies from companies within your industry to gauge the system’s effectiveness.
What are the main differences between standalone project management software and integrated solutions like ERP or CRM systems?
Standalone project management software is designed solely to manage projects and typically offers a more focused set of features tailored to project planning, execution, and monitoring. On the other hand, integrated solutions like ERP or CRM systems combine project management functionalities with other business processes such as accounting, procurement, customer relationship management, and resource planning. While integrated solutions offer a comprehensive approach to managing various aspects of business operations, standalone project management software provides greater flexibility and simplicity for organizations primarily focused on project management workflows.
Operations managers are often responsible for all operational business processes from start to finish. From employees to suppliers, projects, jobs, and meetings, they strive to increase productivity, lower costs, and improve the quality of work. Their job is to empower their team of material planners, schedulers, estimators, warehouse workers, field service technicians, consultants, quality managers, maintenance staff, and laborers with relatable information.
The KPIs for operations managers would always differ based on their responsibilities, the size of the organization, and the industry. Operations management could be as diverse as managing tactical roles such as logistics to strategic roles such as procurement or marketing. Despite being so diverse, weak operations management can lead to weak sales and operations planning, which might, in turn, lead to operational disruptions and inferior customer experience. So, which KPIs for operations managers are the most relevant to ensure streamlined operations?
Operations managers are often tasked with harmonizing diverse functions spanning marketing, retail, human resources, sales, distribution, IT, finance, manufacturing, construction, and professional services. Here is the examination of the top 10 KPIs for operations managers based on each company department. This discusses ten departmental KPIs for operations managers: retail, marketing, human resources, sales, IT operations, distribution, finance, manufacturing, construction, and professional service operations KPIs, respectively. These KPIs serve as instruments, finely tuned to provide chaotic insights into the efficient, effective, and overall healthy operational facets.
Retail KPIs For Operations Managers
1. Gross Margins
Gross margins are critical components of retail KPIs for operations managers. It represents the percentage difference between the revenue generated from sales and the cost of goods sold (COGS). This means it measures the profitability of each product or service.
A high gross margin indicates that a significant portion of revenue is retained after covering the production or acquisition costs. Thus, signaling healthy financial performance. On the contrary, a low gross margin suggests that a substantial portion of revenue is consumed by the cost of goods sold, potentially impacting overall profitability.
Formula: Gross Margin Percentage=[(Total Revenue−Cost of Goods Sold)/Total Revenue]×100.
2. Average Order Value
Average order value provides insights into the average amount customers spend per transaction. AOV is calculated by dividing the total revenue generated by the number of orders. This metric is a valuable indicator of consumer purchasing behavior, reflecting the effectiveness of a company’s sales and marketing strategies.
A high AOV suggests that customers are making more valuable transactions, indicating a successful upselling or cross-selling approach. Conversely, a low AOV may signal the need for strategic adjustments to encourage customers to add more items to their carts. Operations managers keen on maximizing revenue and profitability should closely monitor AOV. They can utilize the insights gained to refine sales tactics, enhance customer experience, and optimize pricing strategies.
Formula: AOV= Total Revenue/Number of Orders
3. Customer Retention
Customer retention measures the ability of a business to retain its existing customers over a specific period. This metric is a testament to the loyalty and satisfaction of customers. It reflects the effectiveness of a company’s products, services, and overall customer experience.
A high customer retention rate indicates a strong and loyal customer base, highlighting successful customer relationship management strategies. Conversely, a low retention rate may signal dissatisfaction or a lack of engagement, prompting operations managers to investigate and implement strategies to improve customer satisfaction and loyalty. Armed with this metric, operations managers can proactively shape strategies to enhance customer engagement, foster brand loyalty, and drive sustained business growth.
Formula: Customer Retention Rate = (Number of Customers at End of Period - Number of New Customers Acquired During Period)/ Numbers of Customers at Start of Period
4. Conversion Rate
Conversion rate measures the percentage of website visitors or potential customers who take a desired action, such as making a purchase. It serves as a critical indicator of the effectiveness of a company’s sales and marketing strategies in turning potential customers into actual buyers.
A high conversion rate suggests that a significant portion of visitors is engaged and motivated to complete a transaction, reflecting the success of the company’s efforts in driving customer actions. Conversely, a low conversion rate may indicate inefficiencies or barriers in the customer journey, prompting operations managers to assess and refine the online shopping experience or marketing tactics.
Formula: Conversion Rate = (Number of Conversion/Number of Website Visitors or Potential Customers)×100
5. Foot Traffic and Digital Traffic
These two are essential retail KPIs for operations managers that provide insights into customer engagement across physical and online channels, respectively. Foot traffic refers to the number of visitors to a physical retail store, while digital traffic encompasses the online presence, measuring the number of visitors to a company’s digital platforms. These metrics indicate the level of interest and interaction customers have with the brand in different spaces.
High foot traffic signifies a bustling physical store, indicating popularity and potential sales opportunities. Similarly, high digital traffic suggests a robust online presence, which can translate into increased digital sales and brand visibility. On the flip side, low foot traffic or digital traffic may signal a need for improved marketing strategies, enhanced customer experiences, or adjustments to product offerings.
6. Inventory Turnover
Inventory turnover measures how efficiently a company manages its inventory by evaluating the number of times inventory is sold and replaced within a specific period. It is defined as the ratio of the cost of goods sold (COGS) to the average inventory during that period. This metric serves as a key indicator of inventory management effectiveness, providing insights into how quickly products are moving off the shelves.
A high inventory turnover ratio typically indicates efficient inventory management, swift sales, and minimized holding costs. Conversely, a low inventory turnover suggests slow-moving stock, potential overstocking issues, and increased holding costs. Operations managers can leverage this metric to fine-tune inventory strategies, optimize stock levels, and ensure a healthy balance between product availability and financial efficiency.
Formula: Inventory Turnover = Cost of Goods Sold (COGS)/Average Inventory
7. Returns and Exchanges
Returns and exchanges are integral components of retail KPIs for operations managers. It includes the volume of products customers bring back or exchange within a specified timeframe. This metric is a crucial measure of customer satisfaction, product quality, and overall operational efficiency.
A high rate of returns and exchanges may indicate potential issues such as dissatisfaction, product defects, or discrepancies between customer expectations and delivered goods. Operations managers must scrutinize the reasons behind high return rates to address underlying concerns, optimize product quality, and enhance customer experiences. Conversely, a low rate of returns and exchanges generally signifies customer contentment and operational effectiveness, indicating that products meet or exceed customer expectations.
Formula: Return and Exchange Rate = (Number of Returns and Exchanges/Total Number of Items Sold)×100
8. Stock Turnover Rate
Stock turnover rate is a metric that assesses how efficiently a company manages its inventory by measuring the number of times stock is sold and replaced within a specific period. This KPI is a key indicator of inventory management efficiency, providing insights into how quickly a company can sell and restock its products.
A high stock turnover rate generally indicates efficient inventory management, where products move briskly, reducing holding costs and potential obsolescence. Conversely, a low turnover rate may suggest overstocking or slow-moving inventory, leading to increased holding costs and the risk of product obsolescence. Operations managers can leverage this KPI to make informed decisions about inventory levels, ensuring a balance between meeting customer demand and optimizing operational costs.
Formula: Stock Turnover rate = Cost of Goods Sold (COGS)/Average Inventory Value
The 2026 Digital Transformation Report
Thinking of embarking on a ERP journey and looking for a digital transformation report? Want to learn the best practices of digital transformation? Then, you have come to the right place.
Sell-through rate quantifies the efficiency of a company in selling its inventory over a specific period. Essentially, it gauges how well a business is managing its stock levels and meeting consumer demand.
A high sell-through rate indicates that products are moving off the shelves swiftly, signifying strong consumer interest and effective inventory management. Conversely, a low sell-through rate may suggest that products are lingering in stock, potentially indicating overstocking, pricing issues, or a lack of demand. Operations managers, by closely monitoring sell-through rate, gain valuable insights into inventory performance, enabling them to make data-driven decisions on pricing strategies, product assortment, and overall inventory management for optimal business outcomes.
Formula: Sell-Through Rate = (Number of Units Sold/Beginning Inventory) ×100
10. Sales Year-Over-Year
Sales year-over-year (YoY) is one of the crucial retail KPIs for operation managers that assesses the percentage change in a company’s sales performance for a specific period compared to the same period in the previous year. It provides a longitudinal perspective on sales trends, allowing operations managers to gauge the overall growth or decline in revenue.
A positive YoY indicates sales growth, showcasing the effectiveness of business strategies and market demand. Conversely, a negative YoY suggests a decline in sales, prompting operations managers to investigate the root causes, adapt strategies, and make informed decisions to reverse the trend.
Formula: Sales Year-Over-Year = [(Current Year Sales - Previous Year Sales)/Previous Year Sales] ×100
Marketing KPIs For Operations Managers
11. Cost Per Click
Cost per click measures the average cost incurred by advertisers each time a user clicks on their online ad. CPC serves as a key metric for evaluating the efficiency and cost-effectiveness of online advertising campaigns.
A high CPC may indicate that the cost of acquiring each click is relatively expensive, possibly requiring a reassessment of the advertising strategy or targeting parameters. Conversely, a low CPC suggests that the advertising campaign is cost-efficient, allowing the company to reach a broader audience for a lower investment. Operations managers can leverage this metric to optimize advertising budgets, refine targeting strategies, and ensure that marketing initiatives generate valuable user engagement at an optimal cost.
Formula: CPC = Total Advertising Cost/Number of Clicks
12. Cost Per Acquisition
Cost per acquisition is one of the fundamental marketing KPIs for operations managers, serving as a metric to evaluate the average expense incurred in acquiring a new customer. CPA is a vital indicator of the efficiency and cost-effectiveness of a company’s marketing campaigns and strategies.
A high CPA suggests that acquiring new customers is relatively expensive, possibly indicating inefficiencies in the marketing approach or the need for optimization. Conversely, a low CPA reflects a more cost-effective strategy for attracting new customers. Monitoring CPA allows operations managers to assess marketing efforts’ return on investment (ROI), guiding strategic decisions and resource allocations to optimize customer acquisition processes effectively.
Formula: CPA = Total Cost of Acquisition/Number of New Customers Acquired
13. Return on Advertising Spend
Return on advertising spend is one of the critical marketing KPIs for operations managers, serving as a quantitative measure of the revenue generated for every dollar spent on advertising. It is a powerful indicator of the effectiveness and efficiency of a company’s advertising campaigns.
A high ROAS implies that the revenue generated significantly exceeds the advertising costs, suggesting a profitable and successful campaign. On the other hand, a low ROAS may indicate that the return on investment from advertising is not meeting expectations, prompting operations managers to reevaluate and refine their marketing strategies. Operations managers can utilize ROAS to optimize marketing budget allocation, identify successful channels, and make data-driven decisions to maximize the impact of advertising efforts on overall business profitability.
Formula: ROAS = Revenue Generated From Advertising/ Cost of Advertising
14. Time to Payback
Time to payback in marketing operations refers to the duration it takes for a company to recover the costs associated with acquiring a new customer. It is essentially a measure of the efficiency of marketing campaigns in terms of cost recovery.
A low time to payback is favorable, signifying a swift recovery of customer acquisition costs and a quicker return on investment. Conversely, a high time to payback suggests a longer period for cost recovery, which may raise concerns about the effectiveness and sustainability of marketing initiatives. Operations managers can use this metric to assess the efficiency of marketing efforts, optimize campaign strategies, and ensure a more rapid and cost-effective return on investment.
Formula: Time to Payback = Customer Acquisition Costs/ Average Monthly Gross Margin per Customer
15. Marketing-Originated Customer Percentage
Marketing-originated customer percentage is a key performance indicator in marketing operations, providing insights into the percentage of customers that can be attributed to marketing efforts within a specific period. It serves as a valuable measure of the effectiveness of marketing campaigns in driving customer acquisition.
A high marketing-originated customer percentage indicates that a significant proportion of new customers were influenced by marketing strategies, showcasing the success of marketing campaigns in attracting and converting leads. On the other hand, a low percentage suggests a need for adjustments in marketing strategies to enhance their impact on customer acquisition. Operations managers can leverage this KPI to gauge the return on marketing investments, refine campaign strategies, and optimize resource allocation to bolster customer acquisition through effective marketing initiatives.
Formula: Marketing-Originated Customer Percentage = (Number of Customers Acquired Through Marketing/Total Number of New Customers) ×100
Human Resource KPIs For Operations Managers
16. Absenteeism rate
The absenteeism rate is a metric that quantifies the frequency and extent of employee absences. It is defined as the percentage of scheduled work hours that employees are absent due to various reasons, such as illness, personal issues, or other unforeseen circumstances. The absenteeism rate provides valuable insights into workforce attendance patterns and employee engagement.
A high absenteeism rate may indicate potential issues within the workplace, such as low morale, dissatisfaction, or health concerns, which can negatively impact overall productivity. Conversely, a low absenteeism rate is generally associated with a motivated and engaged workforce. Operations managers can utilize this KPI to identify trends, address underlying concerns, and implement strategies to promote a healthier and more productive work environment.
Formula: Absenteeism Rate = (Total Scheduled Hours of Absence/Total Scheduled Work Hours) ×100
17. Overtime Hours
Overtime hours refer to the additional hours employees work beyond their regular scheduled work hours. This metric is crucial in understanding human resource utilization and indicates the workload demands on a workforce.
When overtime hours are high, it may signify increased workloads, tight deadlines, or understaffing, potentially leading to concerns about employee burnout, decreased morale, and increased labor costs. On the other hand, low overtime hours suggest efficient workforce management or a period of reduced demand. Operations managers utilize this metric to strike a balance between meeting operational demands and ensuring the well-being and productivity of the workforce.
Formula: Overtime Hours = Total Hours Worked - Scheduled Work Hours
18. Employee Turnover Rate
Employee turnover rate quantifies the percentage of employees who leave a company within a specific timeframe. This metric serves as a key indicator of workforce stability and organizational health.
A high turnover rate may suggest issues such as dissatisfaction, lack of engagement, or inadequate workplace conditions, potentially impacting overall productivity and morale. On the other hand, a low turnover rate typically signifies a stable and content workforce, reflecting positive workplace culture and effective talent management. Operations managers, armed with insights from this metric, can implement targeted strategies to reduce turnover, enhance employee satisfaction, and foster a more resilient and engaged workforce.
Formula: Employee Turnover Rate = (Number of Employees Departed/Average Number of Employees) ×100
19. Employee Efficiency Metrics
Employee efficiency serves as an invaluable KPI for operations managers, providing a comprehensive understanding of workforce productivity. These metrics include:
A high number of deals closed YTD signals a robust and proactive sales effort, showcasing the team’s ability to navigate the sales pipeline and capitalize on opportunities. Conversely, a low number may suggest potential challenges or inefficiencies in the sales process, prompting operations managers to assess and refine sales strategies. Operations managers leverage this KPI to gauge the overall health of the sales function, set realistic targets, and implement targeted improvements to optimize deal conversion rates and, ultimately, drive revenue growth.
21. Customer Churn Rate
Customer churn rate is a critical sales operations KPI that quantifies the percentage of customers who discontinue their relationship with a business within a given period. This metric serves as a key indicator of customer attrition and the overall health of a customer base.
A high churn rate typically suggests issues with customer satisfaction, service quality, or competitive pressures, signaling potential revenue loss. Conversely, a low churn rate indicates a stable and satisfied customer base, reflecting successful customer retention strategies. Operations managers can utilize the churn rate to identify patterns, understand the reasons behind customer departures, and implement targeted measures to enhance customer satisfaction and loyalty.
Formula: Customer Churn Rate = Number of Customers Lost During a Period/Number of Customers at the Start of the Period) ×100
22. Lead-to-Opportunity Ratio
The lead-to-opportunity ratio is a key performance indicator in sales operations to assess the efficiency of converting leads into qualified opportunities. A high lead-to-opportunity ratio suggests a successful lead generation and qualification process, indicating that a substantial percentage of leads are translating into potential revenue-generating opportunities.
Conversely, a low ratio may imply inefficiencies in lead nurturing or qualification, signaling the need for improvements in the sales process to enhance conversion rates. Operations managers in sales can leverage this KPI to refine lead management strategies, optimize marketing efforts, and ensure a streamlined conversion pipeline, ultimately contributing to increased revenue and business success.
Formula: Lear-to-Opportunity Ratio = (Number of Opportunities Created/Number of Leads Generated) ×100
A high lead conversion rate suggests a streamlined and effective sales process, indicating that a significant proportion of leads are progressing through the sales funnel to become valuable customers. On the contrary, a low lead conversion rate may signify inefficiencies or gaps in the sales strategy, prompting operations managers to reassess and optimize their lead management practices. Operations managers can leverage this metric to refine sales strategies, identify areas for improvement, and enhance overall sales performance, ultimately contributing to the company’s bottom line.
Formula: Lead Conversion Rate = (Number of Converted Leads/Total Number of Leads) ×100
IT KPIs For Operations Managers
24. Total Tickets vs Open Tickets
The number of total tickets vs open tickets provides insights into the efficiency of an IT support system. Total tickets represent the overall number of requests or issues raised by users, while open tickets are the subset that remains unresolved or in-progress. In essence, this KPI measures the ratio of resolved or closed tickets to the total number of tickets, offering a snapshot of the IT team’s responsiveness and effectiveness.
A high ratio indicates a swift resolution of issues, suggesting a proficient and agile IT support system. Conversely, a low ratio may signify a backlog of unresolved issues, potential inefficiencies, or challenges in meeting user demands promptly. Operations managers can utilize this KPI to gauge the health of their IT support services, make informed decisions on resource allocation, and ensure that user concerns are addressed in a timely manner, ultimately contributing to enhanced operational efficiency and user satisfaction.
25. Ticket Response Time
The duration it takes for a support team to respond to user-reported issues or service requests is called ticket response time. It serves as a key indicator of the efficiency and effectiveness of an IT support system.
A low response time is generally desirable, as it signifies a prompt acknowledgment of user concerns and a swift initiation of troubleshooting or problem resolution. Conversely, a high response time may indicate delays in addressing user issues, potentially leading to increased user frustration and a negative impact on overall service quality. Operations managers can leverage insights from this KPI to optimize IT support workflows, allocate resources efficiently, and enhance the overall user experience with IT services.
Formula: Ticket Response Time = [(Time of First Response - Time of Ticket Creation)/Number of Tickets]
26. Resolution Rate
Resolution rate is a critical IT operations KPI for operations managers that quantifies the effectiveness of resolving issues or incidents within a specified timeframe. This metric serves as a key performance indicator for IT support teams, measuring their efficiency in addressing and resolving technical challenges.
A high resolution rate signifies a swift and effective response to issues, indicating operational excellence and customer satisfaction. On the other hand, a low resolution rate may suggest inefficiencies in the IT support process. This can potentially lead to prolonged system downtimes and dissatisfied end-users. Operations managers can utilize this metric to gauge the performance of their IT support teams and identify areas for improvement. They can also ensure the smooth functioning of IT operations in alignment with organizational goals.
Formula: Resolution Rate = (Number of Incidents Resolved/Total Number of Incidents Reported) ×100
27. Mean Time to Recover
Mean time to recover quantifies the average time taken to restore a system/service to normal functioning after an incident or outage. It serves as a key performance indicator for operations managers in the IT industry. It also offers valuable insights into the efficiency of incident resolution processes.
A low MTTR indicates a swift and effective response to incidents, minimizing downtime and disruptions to IT services. Conversely, a high MTTR suggests a prolonged recovery process, potentially leading to increased downtime and adverse impacts on productivity. Operations managers use MTTR to assess the effectiveness of incident management, refine response strategies, and ensure timely service restoration. Ultimately, contributing to the resilience and reliability of IT systems within an organization.
Formula: MTTR = Total downtime/Number of Incidents
28. Technology Downtime
Technology downtime is when a system, network, or technology infrastructure is unavailable or not functioning as intended. It is the time when IT services or systems are offline, disrupting normal business operations. This metric is a key indicator of the reliability and resilience of an organization’s technological infrastructure.
A high technology downtime indicates a greater frequency or duration of disruptions. It can potentially lead to decreased productivity, customer dissatisfaction, and financial losses. Conversely, a low technology downtime suggests a more stable and robust IT environment, ensuring seamless business operations. Operations managers can utilize this KPI to pinpoint areas for improvement in IT systems and implement preventive measures. It can also ensure the uninterrupted flow of technology-dependent processes, safeguarding the overall efficiency and reliability of the organization.
Supplier and carrier costs quantify the expenses associated with sourcing materials from suppliers and transporting them through various carriers. It reflects the financial efficiency of the supply chain.
A high score indicates a dependable network, ensuring timely and quality deliveries. On the contrary, a low score may signal disruptions or inconsistencies, prompting operations managers to reassess and potentially diversify their supplier and carrier base. Operations managers can utilize this KPI to identify underperforming partners, negotiate improvements, and ensure a smooth and reliable flow of goods.
31. Inventory Turns and Carrying Costs
Inventory turns and carrying costs represent the number of times inventory is sold or used in a given period and the associated costs of holding that inventory. A high inventory turns value implies efficient inventory management, with goods swiftly transitioning from shelves to customers.
On the flip side, a low value may indicate overstocking, leading to increased carrying costs. Operations managers can utilize these KPIs to refine inventory strategies, minimize holding costs, and enhance overall supply chain efficiency.
Formula: Inventory Turns = Cost of Goods Sold/Average Inventory Value
32. Order Fill and Back Order Rates
Order fill rate measures the percentage of customer orders that are fulfilled completely on the first attempt, while the back order rate tracks the orders that cannot be filled immediately and are delayed.
High order fill rates signify efficiency and customer satisfaction, while high back order rates may indicate inventory shortages or inefficient order processing systems. Operations managers can utilize these KPIs to optimize inventory levels, improve order processing, and enhance customer service.
Formula: Order Fill Rate = Number of Order Filled/ Total Number of Orders
Conversely, a low accuracy rate may lead to order discrepancies and additional costs for corrections. Operations managers can utilize this KPI to identify areas for improvement in warehouse processes, implement training programs, and enhance overall order accuracy.
34. Order Lead Time
Order lead time measures the time it takes from order placement to delivery, encompassing various stages. Short lead times indicate operational efficiency and customer responsiveness, while extended lead times may result in customer dissatisfaction and increased operational costs. Operations managers can utilize this KPIs to streamline processes, optimize workflows, and improve overall supply chain agility.
35. Receiving and Put-Away Cycle Times
Receiving and put-away cycle times evaluate the efficiency of receiving and storing goods upon arrival. Short cycle times indicate streamlined processes, reducing delays in inventory availability.
Prolonged cycle times, on the other hand, may result in operational bottlenecks and increased storage costs. Operations managers can utilize these KPIs to streamline receiving and storage processes, reducing bottlenecks and improving overall warehouse efficiency.
36. Transportation Costs
Transportation costs quantify the expenses associated with moving goods from suppliers to the distribution center and, eventually, to customers. High transportation costs may suggest inefficiencies or suboptimal route planning, impacting overall supply chain profitability. Operations managers can utilize this KPI to optimize transportation routes, negotiate favorable agreements with carriers, and reduce overall distribution expenses.
Formula: Transportation Costs = Cost per Mile x Total Miles Travelled
37. Transportation Delivery(SLA)
Transportation delivery (Service Level Agreement) measures the adherence to agreed-upon delivery timelines. High SLA compliance ensures reliability and customer satisfaction, while low compliance rates may lead to service disruptions and potential damage to customer relationships. Operations managers can utilize this KPI to monitor carrier performance, negotiate improved delivery terms, and ensure the timely arrival of goods.
38. Quote to Cash Cycle Time
Quote to cash cycle time calculates the duration from the initial customer quote to receiving payment. A shorter cycle time indicates a streamlined order-to-payment process, contributing to improved cash flow. Conversely, a prolonged cycle time may result in delayed revenue recognition and increased working capital requirements. Operations managers can utilize this KPI to streamline sales and billing processes, reducing cycle times and improving overall financial performance.
Finance KPIs For Operations Managers
39. Account Receivables Turnover
Accounts receivables turnover is a finance operations KPI that gauges the efficiency of a company in collecting payments from customers. A high turnover indicates a swift conversion of receivables into cash, reflecting strong cash flow and effective credit management.
Formula: Account Receivable Turnover = Net Credit Sales/ Average Accounts Receivable
40. Days Sales Outstanding
Days sales outstanding is a metric that quantifies the average number of days it takes for a company to collect payments after a sale has been made. It serves as a critical finance operations KPI, representing the efficiency of a company’s credit and collection processes.
Formula: Days Sales Outstanding = (Accounts Receivable/ Net Credit Sales) × Number of Days in Period
41. Operating Cash Flow
Operating cash flow is a finance operations KPI that measures the cash generated or used by a company’s core operating activities. It provides insights into a company’s ability to generate cash from its regular business operations. A positive operating cash flow indicates financial health, liquidity, and the capacity to cover operating expenses.
Conversely, a negative operating cash flow may signify liquidity challenges. Operations managers can utilize this KPI to ensure there is sufficient cash to fund ongoing operations, invest in growth opportunities, and meet financial obligations.
Formula: Operating Cash Flow=Net Income+Non-Cash Expenses+Changes in Working Capital
42. Quick Ratio
The quick ratio also known as the acid-test Ratio, is a finance operations KPI that measures a company’s ability to meet its short-term obligations using its most liquid assets. It is a more stringent measure than the current ratio as it excludes inventory from current assets.
A high quick ratio suggests strong liquidity and an ability to cover short-term liabilities promptly. Conversely, a low quick ratio may indicate potential difficulties in meeting short-term obligations. Operations managers can utilize this KPI to assess short-term liquidity and make informed decisions about managing current liabilities.
Formula: Quick Ratio = (Cash + Marketable Securities + Receivables)/ Current Liabilities
43. Accounts Payable Turnover
Accounts payable turnover assesses how efficiently a company manages its accounts payable by measuring the number of times a company pays its average accounts payable during a specific period.
A high turnover suggests effective management of payables and efficient cash flow, while a low turnover may indicate potential liquidity challenges or delayed payments. Operations managers can utilize this KPI to optimize payment processes, negotiate favorable credit terms, and enhance overall financial efficiency.
Formula: Accounts Payable Turnover = Net Credit Purchases/ Average Accounts Payable
44. Cash Conversion Cycle
The cash conversion cycle measures the time it takes for a company to convert its investments in inventory and other resources into cash flow from sales. It reflects the efficiency of a company’s working capital management.
Operating profit margin is a finance operations KPI that measures the profitability of a company’s core operating activities. It is expressed as a percentage and indicates the proportion of revenue that remains as operating profit after deducting operating expenses.
A high operating profit margin suggests operational efficiency and effective cost management, while a low margin may indicate potential challenges in controlling expenses. Operations managers can utilize this KPI to assess the efficiency of core operations, identify cost-saving opportunities, and enhance overall financial performance.
Net profit margin measures the overall profitability of a company by expressing net profit as a percentage of total revenue. It provides insights into a company’s ability to generate profit after all expenses, including taxes and interest.
Formula: Net Profit Margin = (Net Profit/Net Sales) ×100
Manufacturing KPIs For Operations Managers
47. Product Development Costs and Time-to-Market
Product development costs and time-to-market in manufacturing operations KPIs refer to the expenditures incurred and the time taken to bring a new product from conceptualization to market availability. This KPI indicates the efficiency of the product development process, reflecting a company’s innovation speed and cost-effectiveness.
A high value may suggest prolonged development cycles and increased costs, potentially impacting competitiveness. Conversely, a low value signifies swift development and cost control, enhancing market responsiveness. Operations managers can utilize this KPI to streamline innovation processes, optimize resource allocation, and align product releases with market demands.
48. Job Cost and WIP Reporting
Job cost and work-in-progress (WIP) reporting represent the total cost incurred for completing a specific manufacturing job and the ongoing value of work in progress. This KPI indicates the financial efficiency and progress of manufacturing processes, with a high value signaling potential cost overruns or delays.
A low value implies effective cost control and timely job completion. Operations managers can leverage this KPI to manage production costs, improve resource utilization, and optimize workflow.
49. Scrap and Yield Quantities and Costs
Scrap and yield quantities and costs measure the volume of defective or wasted products in comparison to the total produced, along with associated costs. This KPI reflects the efficiency of production processes and product quality.
A high value indicates a high level of waste, which can result in increased costs and reduced profitability. Conversely, a low value signifies efficient production with minimal waste. Operations managers can utilize this KPI to identify areas for quality improvement, optimize production processes, and reduce costs.
50. Manufacturing Labor Efficiency
Manufacturing labor efficiency is a KPI that gauges the productivity of labor in the manufacturing process. This KPI indicates how effectively labor resources are utilized in manufacturing. A high value suggests efficient use of labor, minimizing costs per unit.
Conversely, a low value may indicate inefficiencies, leading to increased labor costs. Operations managers can leverage this KPI to optimize workforce management, identify training needs, and enhance overall production efficiency.
Formula: Manufacturing Labor Efficiency = (Actual Production Output/Standard Production Output) x 100
51. Machine and Resource Throughput
Machine and resource throughput in manufacturing operations KPIs measure the rate at which machines or resources complete tasks within a given time period. This KPI reflects the operational efficiency of machinery and resources.
A high value indicates optimal throughput and resource utilization, contributing to increased productivity. On the contrary, a low value may signal bottlenecks or underutilized resources. Operations managers can use this KPI to identify areas for improvement, allocate resources effectively, and enhance overall production capacity.
52. Production Schedule Attainment
Production schedule attainment is a KPI that assesses the extent to which actual production matches the planned production schedule. This KPI provides insights into operational reliability and adherence to timelines.
A high value suggests a consistent and reliable production schedule, contributing to customer satisfaction. Conversely, a low value may indicate challenges in meeting production targets, potentially affecting customer relationships and order fulfillment. Operations managers can utilize this KPI to optimize production planning, improve resource allocation, and enhance on-time delivery performance.
Formula: Production Schedule Attainment = (Actual Production Output/Planned Production Output) x 100
53. Resource Capacity Utilization
Resource capacity utilization measures the extent to which available resources are utilized in production. This KPI indicates the efficiency of resource allocation and utilization.
A high value suggests optimal utilization, contributing to cost-effectiveness. On the other hand, a low value may indicate underutilized resources, leading to increased per-unit costs. Operations managers can use this KPI to optimize resource allocation, identify areas for improvement, and enhance overall operational efficiency.
Formula: Resource Capacity Utilization = (Actual production Output/Maximum Possible Production Output) x 100
54. Changeover Time
Changeover time is a critical manufacturing operations KPI that measures the time taken to transition from producing one product to another. This KPI indicates the efficiency of changeover processes and the ability to adapt to different production requirements swiftly.
A high value suggests prolonged changeover times, potentially causing production delays and impacting overall efficiency. Conversely, a low value signifies quick and efficient changeovers, enhancing production flexibility. Operations managers can utilize this KPI to optimize production schedules, reduce downtime, and enhance overall operational agility.
55. Overall Equipment Efficiency (OEE)
Overall equipment efficiency is a comprehensive manufacturing operations KPI that assesses the performance, availability, and quality of equipment in the production process. OEE provides a holistic view of equipment effectiveness, with a high value indicating optimal equipment performance.
Conversely, a low value suggests potential areas for improvement, such as increased downtime or reduced production speed. Operations managers can use OEE to identify and address equipment-related inefficiencies, improve maintenance strategies, and enhance overall production effectiveness.
56. Sub-Contractor Performance
Sub-contractor performance is a KPI that evaluates the effectiveness and reliability of subcontractors engaged in the manufacturing process. This KPI indicates the impact of external contributors on overall operational success. A high value signifies dependable subcontractors contributing positively to production.
In contrast, a low value may indicate challenges such as delays or quality issues introduced by subcontractors. Operations managers can utilize this KPI to make informed decisions about subcontractor relationships, optimize supply chain partnerships, and ensure consistent production quality.
57. Capable-to-Promise (CTP)%
Capable-to-promise is a manufacturing operations KPI that evaluates a company’s ability to commit to fulfilling customer orders based on current production capabilities. This KPI indicates how effectively a company can meet customer expectations regarding order fulfillment.
A high CTP% value suggests a robust production system capable of accommodating customer demands. Conversely, a low value may indicate challenges in meeting order commitments, potentially affecting customer satisfaction. Operations managers can leverage this KPI to enhance production planning, optimize inventory levels, and improve customer order fulfillment.
Formula: CTP% = (Available-to-Promise/Total Demand) x 100
Construction KPIs For Operations Managers
58. Safety/Incident Rate
Safety/Incident rate is a crucial construction operations KPI that measures the frequency of safety incidents or accidents on a construction site. This metric is defined as the number of incidents (injuries, accidents, or near misses) per a specific unit of measurement. It is often expressed per 100,000 work hours.
A low safety/incident rate is indicative of a safe work environment, emphasizing the success of safety protocols and measures. Conversely, a high rate may signal potential hazards, prompting operations managers to reassess safety procedures. Operations managers can utilize this KPI to prioritize and enhance safety measures. Also, ensuring the well-being of the workforce and compliance with safety regulations.
59. Request for Information Win Rates
Request for information(RFI) win rates assesses the success of winning contracts or projects after responding to requests for information. A high win rate indicates effective bidding strategies and a competitive edge in the market. While a low rate may signify areas that require improvement. Operations managers can utilize this KPI to refine bidding approaches, better understand market dynamics, and optimize resource allocation.
Formula: Request for Information(RFI) Win Rates = (Number of Projects Won/Total Number of RFIs Submitted) x 100
60. Job Cost, Revenue, and Profitability
Job cost, revenue, and profitability are vital construction operations KPIs that gauge the financial performance of construction projects. The total expenses incurred during a project are job costs, the income generated is the revenue, and profitability is the net profit derived from subtracting costs from revenue.
High job costs relative to revenue can indicate financial inefficiency, while low profitability may signal unsuccessful project management. Operations managers can utilize these metrics to assess project financial health, and identify areas for cost optimization.
61. Quality Defects, Rework Costs and Time, Number of Inspections
Quality defects, rework costs and time, and number of inspections are interconnected construction operations KPIs. They measure the quality and efficiency of construction projects. On one hand quality defects represent deviations from project specifications. While rework costs and time quantify the resources spent on correcting defects. The number of inspections measures how frequently quality checks are conducted.
Low quality defects, rework costs, and inspection frequency indicate efficient project execution. While high values may suggest the need for improved quality control. Operations managers can utilize these KPIs to streamline project processes, enhance quality control, and minimize unnecessary expenditures.
62. Employee Retention
Employee retention measures the percentage of employees who remain with the construction company over a specific period. High employee retention signifies a positive work environment, skilled workforce, and effective management.
Conversely, low retention rates may signal issues with workplace satisfaction or leadership. Operations managers can utilize this KPI to implement strategies for talent retention. They can also foster a positive workplace culture, and address any underlying concerns.
Formula: Employee Retention Rate = (Number of Employee Retained/Total Number of Employees at Start of Period) x 100
63. Labor Efficiency/Utilization
Labor efficiency assesses how effectively labor resources are utilized on a construction project. High labor efficiency indicates optimal resource utilization, while low efficiency may suggest underutilization or inefficiencies in project planning. Operations managers can utilize this KPI to optimize workforce allocation, improve project scheduling, and enhance overall labor productivity.
Subcontractor inventory is a construction operations KPI that evaluates the availability and efficiency of subcontractors for construction projects. It is defined as the number of qualified subcontractors available for hire at any given time.
High subcontractor inventory indicates a robust network of qualified subcontractors, facilitating flexibility in project staffing. On the other hand, a low inventory may lead to delays and increased costs. Operations managers can utilize this KPI to ensure a reliable pool of subcontractors, manage project timelines effectively, and mitigate risks associated with subcontractor availability.
Professional Service KPIs For Operations Managers
65. Average and Realized Bill Rates
Average bill rate represents the average price charged for professional services, while realized bill rate is the actual revenue generated per billable hour. These metrics provide insights into the pricing structure’s effectiveness and how well it aligns with the market. High rates indicate value perception, but if too high, it may lead to client dissatisfaction. Low rates may attract clients, but it could impact profitability.
66. Employee Utilization/Billable Rate
Employee utilization/billable rate gauges the percentage of an employee’s time spent on billable client work. High utilization rates signify efficient resource allocation, but excessive rates may lead to burnout. Low rates suggest underutilization, potentially impacting revenue. Operations managers can optimize team productivity by balancing utilization rates.
67. Billable Revenue Per Resource
Billable revenue per resource measures the average revenue generated per service professional. A high figure indicates efficient resource utilization, while low figures may signify inefficiencies. Operations managers can use this metric to assess team productivity and adjust staffing levels to meet demand.
68. Project Estimate Accuracy
Project estimate accuracy reflects how closely initial project estimates align with the actual effort and cost. High accuracy signifies effective project planning, leading to client satisfaction and profitability. Low accuracy may result in cost overruns and strained client relationships.
69. Project/Service Revenue, Profitability, Deal Size, and Bid-to-Win Ratios
These encompass a suite of metrics evaluating project or service success. Revenue and profitability showcase financial performance, deal size indicates project scale, and bid-to-win ratios highlight the effectiveness of securing new projects. High values across these metrics indicate successful project management and business development.
70. SaaS Contract Metrics (ARR, ACV, and Churn)
Annual recurring revenue (ARR), Annual contract value (ACV), and churn rate are very important metrics for SaaS contracts. ARR and ACV showcase subscription revenue, while Churn measures customer retention. High ARR and ACV are favorable, while low Churn indicates satisfied customers. Operations managers can use these metrics to refine subscription pricing, improve service, and ensure long-term customer relationships.
Formula:
ARR = Monthly Recurring Revenue (MRR) x 12
ACV = Average Monthly Contract Value (MCV) x 12
Churn Rate = (Number of Customers Lost/Total Customers at Start of Period) x 100
From the intricate details of retail operations, such as gross margins and inventory turnover, to the intricacies of human resources, including absenteeism rate and employee turnover, and extending to the critical domains of sales, IT operations, manufacturing, finance, construction and distribution, each KPI paints a distinct picture of efficiency, effectiveness, and overall operational health. These KPIs for operations managers act as instruments, finely tuned to provide insights into the complex landscape of operational facets.
+
ERP Implementation Failure Recovery
Learn how Frederick Wildman struggled with Microsoft Dynamics 365 ERP implementation failure even after spending over $5M and what options they had for recovery.
KPIs (key performance indicators) for an operations manager may include a range of metrics across different areas such as retail, human resources, IT, finance, marketing, sales, distribution, manufacturing, construction, and professional services.
How do you measure operations manager performance?
Operations manager performance can be measured by assessing their effectiveness in achieving key objectives and targets related to the specific KPIs relevant to their role. This involves monitoring and evaluating their contributions to the success of the organization in areas such as cost management, efficiency, employee management, and overall operational excellence. Regular performance reviews, feedback sessions, and data-driven assessments based on KPIs can be used to gauge their effectiveness.
What are KPIs to improve operational performance?
To improve operational performance, organizations can focus on key performance indicators that highlight areas for enhancement and growth. Some overarching KPIs to consider for improving operational performance include retail, human resources, IT, finance, marketing, sales, distribution, manufacturing, construction, and professional services KPIs respectively.
A skilled inventory manager is one who carefully balances customer satisfaction with efficient capital management. Inventory managers take on the central role, overseeing the seamless flow of goods, optimizing stock levels, and ensuring the availability of the right products at the right time. Their responsibilities span from managing warehouse operations to refining procurement strategies, all geared towards enhancing the company’s overall performance.
Assessing the effectiveness involves measuring the KPIs for inventory managers, which act as valuable metrics for evaluating the success of inventory-related processes. Precision and efficiency are paramount in inventory management, necessitating to track specific KPIs for inventory managers which can provide insights into various facets of their operations. These metrics not only pinpoint areas for improvement but also empower inventory managers to make informed decisions that positively impact the company’s bottom line.
The inventory turnover rate is one of the sales KPIs for inventory managers that measures the number of times a company’s inventory is sold and replaced over a specific period, usually a year. A high turnover rate indicates that products are selling quickly, which is beneficial for cash flow and minimizing the holding costs of unsold items. Conversely, a low turnover rate suggests slow-moving inventory, tying up capital and potentially leading to obsolescence. This KPI is crucial for an inventory manager as it reflects the efficiency of stock management, helping them adapt strategies to align with market demands and optimize capital usage.
Inventory turnover rate = cost of goods sold / average inventory
2. Days on Hand
Days on hand is a sales KPI that measures the average number of days or weeks it takes to sell the current inventory. A low value signifies quick inventory turnover, which is positive for cash flow and reduces holding costs. On the other hand, a high value may indicate overstocking or slow-moving products, leading to potential obsolescence and tying up capital. These KPIs are vital for an inventory manager as they provide insights into the balance between stock levels and sales velocity, enabling strategic adjustments to align with market demands.
Days of inventory on hand = (average inventory for period / cost of sales for period) x 365
3. Stock to Sales Ratio
The sales KPI for inventory managers that compares the amount of stock on hand to the current sales volume is known as the stock to sales ratio. A high ratio may indicate overstocking, tying up capital, and potentially leading to increased holding costs. A low ratio could suggest potential stockouts, impacting customer satisfaction and sales revenue. For an inventory manager, maintaining an optimal stock to sales ratio is essential for ensuring inventory aligns with sales demand, minimizing holding costs, and maximizing profitability.
Stock to sales ratio = $ inventory value / $ sales value
4. Sell-through Rate
The sell-through rate is responsible for measuring the percentage of available inventory sold during a specific period. A high sell-through rate indicates efficient sales, minimizing the risk of overstocking and reducing holding costs. Conversely, a low sell-through rate may signify slow-moving inventory, potentially leading to obsolescence. This KPI is crucial for an inventory manager as it guides decisions on product promotions, pricing, and inventory replenishment strategies to optimize sales and prevent overstock.
Sell-through rate = (# units sold / # units received) x 100
5. Backorder Rate
This sales KPI for inventory managers measures the percentage of customer orders that cannot be fulfilled immediately due to insufficient stock. A low backorder rate indicates efficient inventory management, enhancing customer satisfaction. Whereas, a high backorder rate may result in lost sales and dissatisfied customers. For an inventory manager, minimizing the backorder rate is crucial for meeting customer demand, retaining business, and optimizing sales revenue.
Backorder Rate = (# delayed orders due to backorders / total # orders placed) x 100
6. Accuracy of Forecast Demand
The accuracy of forecast demand, a sales KPI for inventory managers evaluates how closely the forecasted demand aligns with actual sales. High accuracy suggests effective forecasting, minimizing stockouts and overstock situations. On the other hand, low accuracy may lead to inefficient inventory levels and potential lost sales. This KPI is vital for an inventory manager as it influences purchasing decisions, warehouse operations, and overall inventory optimization, ensuring resources are allocated efficiently.
Accuracy of Forecast Demand = [(actual – forecast) / actual] x 100
The 2026 Digital Transformation Report
Thinking of embarking on a ERP journey and looking for a digital transformation report? Want to learn the best practices of digital transformation? Then, you have come to the right place.
The rate of return measures the percentage of sold items that are returned by customers. A low return rate indicates customer satisfaction and product quality. Conversely, a high return rate may suggest issues with product quality, leading to potential financial losses. For an inventory manager, monitoring the rate of return is crucial for maintaining customer satisfaction, identifying product issues, and implementing corrective measures to optimize sales and minimize returns.
8. Product Sales
Product sales is a sales KPI that represents the total units of a specific product sold within a given period. High product sales indicate strong market demand and successful product positioning and, low product sales may suggest the need for marketing adjustments or potential product obsolescence. This KPI is important for an inventory manager as it informs decisions on inventory replenishment, marketing strategies, and overall product lifecycle management.
9. Revenue per Unit
Revenue per unit calculates the average revenue generated by selling one unit of a product. High revenue per unit suggests effective pricing strategies and profitable product offerings. On the contrary, low revenue per unit may require pricing adjustments or a reevaluation of the product’s market positioning. For an inventory manager, understanding revenue per unit is crucial for optimizing pricing strategies, maximizing profitability, and making informed decisions about product offerings.
Revenue per unit = total revenue for period / average units sold for period
10. Cost per Unit
Cost per unit measures the average cost incurred to produce or purchase one unit of a product. Low cost per unit indicates efficient cost management, contributing to higher profit margins. Conversely, high cost per unit may impact profitability and require cost reduction strategies. For an inventory manager, monitoring cost per unit is essential for optimizing procurement strategies, negotiating with suppliers, and ensuring cost efficiency in the production or purchasing process.
Cost per unit = (fixed costs + variable costs )/ # units produced
11. Gross Margin by Product
Gross margin by product is a sales KPI for inventory managers which calculates the percentage of revenue retained after deducting the cost of goods sold for a specific product. A high gross margin indicates profitability, while a low margin may require a reevaluation of pricing or production costs. This KPI is vital for an inventory manager as it guides decisions on product pricing, procurement strategies, and overall product profitability, contributing to the company’s financial success.
Gross margin = [(net sales – cost of goods sold) / net sales] x 100
12. Gross Margin Return on Investment (GMROI)
Gross margin return on investment (GMROI), a sales KPI for inventory managers, evaluates the profitability of inventory investments by comparing the gross margin to the average inventory investment. A high GMROI indicates efficient use of capital and inventory profitability while a low GMROI may suggest the need for inventory optimization strategies. This KPI is essential for an inventory manager as it guides decisions on inventory investment, product assortment, and overall profitability, maximizing returns on capital employed.
Gross margin return on investment = gross margin / average inventory cost
Warehouse KPIs For Inventory Managers
13. Time to Receive
Time to receive is a warehouse KPIs for inventory managers which measures the average time taken to receive and store incoming inventory. A low time to receive indicates efficient warehouse operations, reducing the time products spend in transit. Conversely, a high time to receive may lead to delays in inventory availability. This KPI is important for an inventory manager as it impacts inventory replenishment speed, reducing the risk of stockouts and optimizing overall operational efficiency.
Time to receive = time for stock validation + time to add stock to records + time to prep stock for storage
14. Put Away Time
Put away time is a warehouse KPI for inventory managers that measures the average time taken to place received inventory into its designated storage location within the warehouse. A low put away time indicates efficient warehouse operations, reducing the time products spend in transition between receiving and storage. On the other hand, a high put away time may lead to delays in making inventory available for order fulfillment. This KPI is vital for inventory managers as it directly impacts the speed at which products become accessible for sale, minimizing the risk of stockouts and optimizing overall warehouse efficiency.
Put away time = total time to stow received stock
15. Supplier Quality Index
The supplier quality index is a warehouse KPI that assesses the quality of products received from suppliers. A high index indicates reliable and high-quality suppliers, reducing the risk of defects and returns. Conversely, a low index may suggest issues with product quality and supplier reliability. This KPI is crucial for an inventory manager as it influences supplier selection, inventory quality, and overall customer satisfaction, ensuring a seamless flow of high-quality products.
Supplier quality index = (material quality x 45%) + (corrective action x 10%) + (prompt reply x 10%) + (delivery quality x 20%) + (quality systems x 5%) + (commercial posture x 10%)
Operational KPIs For Inventory Managers
16. Lost Sales Ratio
The lost sales ratio is an operational KPI for inventory managers that measures the percentage of potential sales lost due to stockouts. A low lost sales ratio indicates effective inventory management, minimizing revenue loss. Whereas, a high ratio suggests the need for inventory optimization to prevent lost sales opportunities. This KPI is vital for an inventory manager as it highlights the impact of stockouts on revenue and guides decisions on inventory replenishment strategies.
Lost sales ratio = (# days product is out of stock / 365) x 100
17. Perfect Order Rate
Perfect order rate evaluates the percentage of orders that are fulfilled without errors. A high perfect order rate indicates efficient order processing and customer satisfaction. On the contrary, a low rate suggests issues with order accuracy, potentially leading to customer dissatisfaction and increased operational costs. This KPI is important for an inventory manager as it reflects the overall effectiveness of order fulfillment processes and guides improvements to enhance customer experience.
Perfect order rate = [(# orders delivered on time / # orders) x (# orders complete / # orders) x (# orders damage free / # orders) x (# orders with accurate documentation / # orders)] x 100
18. Inventory Shrinkage
Inventory shrinkage is an operational KPI for inventory managers that measures the loss of inventory due to theft, damage, or errors. A low shrinkage rate indicates effective security and inventory control measures. Conversely, a high rate suggests vulnerabilities in inventory management, impacting profitability. This KPI is crucial for an inventory manager as it guides decisions on security measures, inventory control, and loss prevention strategies, ensuring the integrity of the inventory.
Inventory shrinkage = ending inventory value – physically counted inventory value
19. Average Inventory
Average inventory calculates the average value of inventory during a specific period. A low average inventory suggests efficient stock turnover and capital usage. Whereas, a high average inventory may indicate overstocking and tie up capital. This KPI is vital for an inventory manager as it provides insights into the balance between stock levels and operational efficiency, guiding decisions on inventory optimization strategies.
Average inventory = (beginning inventory + ending inventory) / 2
20. Inventory Carrying Cost
Inventory carrying cost calculates the total cost of holding and storing inventory. A low carrying cost indicates efficient inventory management, minimizing expenses tied up in unsold stock while, a high carrying cost may suggest the need for inventory optimization to reduce financial impact. This KPI is crucial for an inventory manager as it influences decisions on inventory levels, storage solutions, and overall cost efficiency.
Inventory carrying costs = [(inventory service costs + inventory risk costs + capital cost + storage cost) / total inventory value] x 100
21. Customer Satisfaction Rate
Customer satisfaction rate measures the satisfaction of customers with the company’s products and services. A high satisfaction score indicates positive customer experiences, contributing to brand loyalty and, a low score may suggest areas for improvement to prevent customer dissatisfaction. This KPI is important for an inventory manager as it reflects the impact of inventory management on customer satisfaction, guiding improvements to enhance overall customer experience.
Customer satisfaction score = (# positive responses / # total responses) x 100
22. Fill Rate
Fill rate measures the percentage of customer orders fulfilled from available stock. A high fill rate indicates efficient order fulfillment, enhancing customer satisfaction. Conversely, a low fill rate may lead to backorders and customer dissatisfaction. This KPI is vital for an inventory manager as it guides decisions on inventory levels, order processing efficiency, and overall customer service improvement.
Fill rate = [(# total items – # shipped items) / # total items] x 100
23. Gross Margin Percent
Gross margin percent calculates the percentage of revenue retained after deducting the cost of goods sold. A high gross margin percentage indicates profitability, while a low margin may require adjustments to pricing or cost reduction strategies. This KPI is crucial for an inventory manager as it guides decisions on pricing strategies, procurement efficiency, and overall profitability, contributing to the financial success of the company.
Gross margin percent = [(total revenue – cost of goods sold) / total revenue] x 100
24. Order Cycle Time
Order cycle time measures the average time taken to fulfill a customer order from initiation to delivery. A low order cycle time indicates efficient order processing and quick delivery, enhancing customer satisfaction. Conversely, a high cycle time may lead to delays and customer dissatisfaction. This KPI is important for an inventory manager as it guides improvements in order processing efficiency, reducing lead times and optimizing overall operational performance.
Order cycle time = (time customer received order – time customer placed order) / # total shipped orders
25. Stock-Outs
Stock-outs measure instances where products are not available when customers demand them. A low occurrence of stockouts indicates effective inventory management, minimizing revenue loss and customer dissatisfaction. On the other hand, frequent stockouts may suggest issues with inventory optimization strategies. This KPI is vital for an inventory manager as it reflects the impact of inventory availability on customer satisfaction and guides decisions on inventory replenishment strategies.
Stock-outs = (# items out of stock / # items shipped) x 100
26. Service Level
Service level measures the percentage of customer demand that a company can fulfill. A high service level indicates effective inventory management, meeting customer demand, and enhancing satisfaction while a low service level may lead to lost sales and dissatisfaction. This KPI is crucial for an inventory manager as it guides decisions on inventory levels, order fulfillment strategies, and overall customer service improvement.
Service level = (# orders delivered / # orders received) x 100
27. Lead Time
Lead time measures the time taken from placing an order to receiving the inventory. A low lead time indicates efficient supply chain operations and quick product availability. Conversely, a high lead time may lead to delays in order fulfillment and potential stockouts. This KPI is important for an inventory manager as it guides decisions on supplier relationships, order planning, and overall supply chain efficiency.
Lead time = order process time + production lead time + delivery lead time
28. Dead Stock/Spoilage
Dead stock/spoilage measures the percentage of inventory that has become obsolete or spoiled. A low dead stock/spoilage rate indicates effective inventory management and minimizes financial losses. Whereas, a high rate may suggest issues with product demand forecasting or storage conditions. This KPI is vital for an inventory manager as it guides decisions on inventory levels, product lifecycle management, and overall inventory optimization.
Dead/spoiled stock = (amount of unsellable stock in period / amount of available stock in period) x 100
29. Available Inventory Accuracy
Available inventory accuracy measures the precision of inventory records in reflecting the actual available stock. High accuracy ensures reliable inventory information for decision-making while low accuracy may lead to errors in order fulfillment and operational inefficiencies. This KPI is crucial for an inventory manager as it guides decisions on inventory tracking systems, technology investments, and overall data accuracy, ensuring reliable information for optimal inventory management.
Available inventory accuracy = (# counted items that match record / # counted items) x 100
30. Internal WMS Efficiency
Internal WMS efficiency measures the effectiveness and accuracy of the internal warehouse management system. High efficiency ensures smooth warehouse operations and accurate inventory tracking. Conversely, low efficiency may lead to errors in order fulfillment and operational disruptions. This KPI is important for an inventory manager as it guides decisions on technology investments, system optimizations, and overall warehouse management, enhancing operational efficiency.
Internal WMS efficiency (ROI) = (gain on investment – cost of investment) / cost of investment
Conclusion
In conclusion, mastering the art of effective inventory management is essential for businesses. Skilled inventory managers play a central role in achieving this delicate balance between customer satisfaction and capital efficiency. The intricate responsibilities they shoulder, from overseeing seamless product flow to optimizing stock levels, contribute significantly to a company’s overall success.
Assessing the effectiveness of inventory management involves delving into KPIs for inventory managers. These are indispensable metrics that serve as a compass for evaluating the triumphs of inventory-related processes. These metrics serve not only to pinpoint areas for improvement but also to empower inventory managers with informed decision-making capabilities. Thus, ultimately influencing the company’s bottom line positively.
This blog has delved into the top 30 KPIs for inventory managers, categorized into three main dimensions: sales KPIs, receiving/warehouse KPIs, and operational KPIs. By comprehending and strategically leveraging these metrics, inventory managers can navigate the intricate landscape of inventory management. They can streamline processes, elevate customer satisfaction, and contribute substantially to the holistic success of the company.
+
ERP Implementation Failure Recovery
Learn how Frederick Wildman struggled with Microsoft Dynamics 365 ERP implementation failure even after spending over $5M and what options they had for recovery.
Why is the inventory turnover rate important for an inventory manager?
The inventory turnover rate is a crucial sales KPI for inventory managers as it measures the number of times a company’s inventory is sold and replaced over a specific period. A high turnover rate indicates efficient stock management, benefiting cash flow and minimizing holding costs. Conversely, a low turnover rate suggests slow-moving inventory, tying up capital. This KPI helps inventory managers adapt strategies to align with market demands and optimize capital usage.
What does the lost sales ratio indicate, and why is it important for inventory managers?
The lost sales ratio is an operational KPI that measures the percentage of potential sales lost due to stockouts. A low ratio indicates effective inventory management, minimizing revenue loss. A high ratio suggests the need for inventory optimization to prevent lost sales opportunities. This KPI is vital for inventory managers as it highlights the impact of stockouts on revenue and guides decisions on inventory replenishment strategies.
How does internal WMS efficiency (ROI) contribute to effective inventory management?
Internal WMS efficiency measures the effectiveness and accuracy of the internal warehouse management system. High efficiency ensures smooth warehouse operations and accurate inventory tracking. This KPI is important for inventory managers as it guides decisions on technology investments, system optimizations, and overall warehouse management, enhancing operational efficiency and contributing to effective inventory management.
A Transportation Management System (TMS) is crucial in logistics and 3PL. However, its definition often depends on the context. For many transportation providers and third-party logistics firms, a TMS acts as their ERP—handling up to 90% of daily operations. Traditionally, these platforms lacked built-in accounting features, requiring external integration with systems like Sage or Microsoft GP. However, the emergence of cloud-based, end-to-end TMS solutions has changed this dynamic. These newer platforms often include native accounting capabilities, which, while convenient, add layers of complexity when selecting the right solution.
TMS systems span a broad spectrum of use cases. Some are built as operational platforms for logistics consulting firms managing transportation on behalf of clients. Others are directly impacted by internal dynamics—particularly when the vendor also manages a carrier network. In such cases, political and competitive factors can affect carrier participation, which may skew rating algorithms and compromise the objectivity of AI- or ML-driven insights. This has led to a growing concern in the industry over the “independence” of a TMS. An independent TMS provider offers pure-play technology without engaging in freight execution, aiming for neutrality in algorithmic decision-making and network participation.
That said, not all independent TMS providers steer clear of operating their own carrier networks. Some maintain these networks to simplify onboarding processes and enhance access to key data streams, such as real-time tracking, ETAs, and exception alerts. Furthermore, TMS systems differ not just in their independence but also in their transportation mode support and geographic coverage. Understanding these distinctions is vital for businesses looking to align TMS functionality with their operational scale, geographic footprint, and digital maturity.
10. CH Robinson/Navisphere TMS
Navisphere, the TMS platform developed by CH Robinson, offers a unique blend of transportation management technology and logistics expertise. Its value is most pronounced for companies seeking an all-in-one solution that combines multi-modal transportation support with managed services. Navisphere is especially strong in the food and produce sectors. It helps shippers tap into CH Robinson’s large carrier network, consolidate freight, and access volume-based discounts. The platform suits businesses that want to streamline transportation using one provider for both software and hands-on supply chain services.
Navisphere’s strength in integrated logistics can also be a drawback. It may not suit organizations that value independence and flexibility in a TMS. Companies working with multiple vendors or needing broader third-party integrations may find it too limiting. The platform ties closely to CH Robinson’s proprietary network. Additionally, the perceived conflict of interest in CH Robinson’s pricing algorithms and limited network scope may raise concerns for some. Is Navisphere the right fit for your transportation strategy? Or would a more independent, scalable TMS better serve your growing network needs? Download the Ultimate Top 10 TMS Systems Report now to compare Navisphere with the leading solutions in the market.
9. Trimble TMS
Trimble is a feature-rich TMS platform built specifically for the needs of trucking companies and 3PLs with internal fleets. Its strengths lie in advanced driver compliance, telematics integration, and load planning—making it a compelling choice for businesses whose core operations revolve around freight movement. With pre-built compliance workflows and deep domain expertise, Trimble significantly reduces administrative overhead while enhancing operational visibility. Fleet managers can rely on Trimble’s mapping and dispatch tools to streamline scheduling, ensure regulatory compliance, and monitor fleet performance in real time.
Trimble focuses heavily on the transportation sector. Its benefits closely tie to that niche. This focus can limit its relevance for retail, distribution, or manufacturing companies that need broader, cloud-native TMS capabilities. The platform’s reliance on legacy technology and its managed-service model may also pose scalability and independence challenges for some businesses. Is Trimble the right fit for your logistics operations, or would a more flexible, cloud-first TMS better align with your long-term strategy? Are you prioritizing trucking-specific compliance or cross-industry adaptability? Download the Ultimate Top 10 TMS Systems Report now to explore how Trimble compares to other leading platforms and find the solution best suited to your business.
8. Descartes TMS
Descartes stands out as a powerful TMS platform for enterprises managing complex, international, and multi-modal supply chains. With capabilities tailored to regulatory compliance, visibility, and international logistics data analytics, Descartes is a best-of-breed solution for global organizations that need more than just basic transportation planning. Its portfolio includes not only an enterprise-grade TMS but also a separate platform designed for trucking companies and 3PL providers, giving it flexibility to serve both large and niche market segments effectively.
However, Descartes may not be the ideal fit for every business. Its reliance on managed services could limit the level of independence some companies expect from their TMS provider. Additionally, smaller businesses might find Descartes cost-prohibitive and may prefer more affordable, all-in-one solutions. And since Descartes focuses purely on transportation, companies may need to integrate it with external systems like WMS or S&OP tools to achieve full supply chain orchestration. Does your organization need a specialized TMS for global multi-modal logistics, or are you looking for a more integrated, suite-based platform? Are managed services a benefit—or a barrier—for your team’s control and visibility? Download the Ultimate Top 10 TMS Systems Report now to explore how Descartes compares to other top solutions.
7. Korber/MercuryGate
MercuryGate’s developers tailored this cloud-native TMS platform for SMBs ready to move beyond basic shipping tools like Pacejet or ShipStation. Its modern architecture and intuitive interface make it especially appealing to direct-to-consumer (DTC) and consumer packaged goods (CPG) companies looking for a scalable solution that aligns with cloud-first ERP systems like NetSuite or Acumatica. With capabilities in fleet management, claims processing, and last-mile logistics, MercuryGate provides a solid foundation for smaller businesses that want more control and visibility without the complexity of a large enterprise platform.
Now part of the Körber supply chain portfolio, MercuryGate has the potential to evolve into a more comprehensive solution. However, as it currently stands, its limited international reach, lack of pre-integrated WMS/S&OP features, and basic reporting tools could hinder adoption by larger or more global operations. Will MercuryGate’s roadmap align with your company’s growing complexity? Do its North American strengths match your geographic footprint, or will you need a platform with more global reach? Download the Ultimate Top 10 TMS Systems Report now to compare MercuryGate with the leading TMS platforms.
6. 3Gtms TMS (Pacejet)
3Gtms is purpose-built for SMB trucking companies looking for an all-in-one TMS that supports LTL, FTL, and parcel shipments. Its recent acquisition of Pacejet has extended its reach into the parcel space, making it a compelling choice for domestic shippers seeking a cost-effective and comprehensive transportation management solution. With advanced dispatch and load planning features, 3Gtms especially suits businesses running lighter, less complex shipping operations—particularly those working within ERP ecosystems like Acumatica or Infor CloudSuite Industrial (SyteLine).
However, 3Gtms may not be the right fit for companies with international operations or those needing enterprise-grade scalability. It lacks the fully integrated suite of solutions that larger, cloud-native platforms provide, and some advanced capabilities may require third-party add-ons. Is your business focused on domestic transportation with moderate complexity, or are you gearing up for global expansion? Are you willing to sacrifice integrated suite functionality for a more targeted and streamlined TMS experience? Download the Ultimate Top 10 TMS Systems Report now to see how 3Gtms compares to the top platforms and discover which TMS best fits your business goals.
The 2026 Digital Transformation Report
Thinking of embarking on a ERP journey and looking for a digital transformation report? Want to learn the best practices of digital transformation? Then, you have come to the right place.
e2open stands out as one of the most robust and integrated supply chain platforms available, combining execution, planning, and collaboration across global networks. Tailored for large enterprises, particularly those operating on SAP or Oracle, it offers powerful forecasting tools enhanced by AI and ML, enabling smarter, more agile decision-making across complex supply chains. With coverage of all major transportation modes—road, rail, ocean, and air—e2open is particularly effective for companies that rely on close collaboration with suppliers, distributors, and logistics partners worldwide.
However, e2open’s depth and scale come with trade-offs. Its complexity may overwhelm smaller companies, and its recent integration into the WiseTech Global ecosystem—alongside Bloom Global—raises questions about its long-term neutrality. For enterprises, this acquisition may prove synergistic, but others might view it as a potential limitation. Is your organization ready for a platform with such scale and depth? Do you prioritize a unified planning-execution platform, or would a more focused TMS better serve your needs? Download the Ultimate Top 10 TMS Systems Report now to compare e2open with other leading platforms.
4. Manhattan Associates
Manhattan is best known for its industry-leading WMS, but its integrated TMS capabilities make it an attractive choice for enterprises operating in retail-heavy sectors such as grocery, footwear, and apparel. For businesses already leveraging Manhattan’s WMS, adding its TMS functionality can streamline operations, reduce integration costs, and support high-volume, store-based fulfillment strategies. The native interoperability between warehouse and transportation systems enables synchronized inventory and shipping workflows—particularly valuable for companies handling complex last-mile logistics.
However, Manhattan’s TMS offering is more of an add-on than a core focus, and it may not match the depth of best-of-breed TMS platforms. Additionally, developers designed the suite for large enterprises, which may overwhelm or be too costly for SMBs. Is your organization already using the Manhattan ecosystem and looking to strengthen WMS-TMS integration? Or would a standalone TMS with stronger transportation capabilities suit you better? Download the Ultimate Top 10 TMS Systems Report now to explore how Manhattan stacks up against other leading platforms.
3. SAP Transportation Management
SAP Transportation Management (SAP TM) is purpose-built for enterprises already invested in the SAP ecosystem, especially those using SAP Extended Warehouse Management (EWM) or SAP S/4HANA. Its value lies in native integration across SAP’s broader supply chain and finance solutions, enabling centralized visibility, compliance, and transaction traceability—particularly beneficial for global companies and distributors with complex logistics requirements. SAP TM is a compelling choice for organizations with sophisticated workflows, such as 3PL providers managing multi-party billing and large-scale freight operations.
That said, SAP TM can be too intricate and costly for SMBs or companies not deeply embedded in SAP technologies. Additionally, core transportation capabilities like carrier communication may require third-party tools such as Descartes, adding complexity and expense. Are you already using SAP and looking to extend functionality with a natively integrated TMS? Or is your business better served by a platform that offers standalone TMS depth with a lighter IT footprint? Download the Ultimate Top 10 TMS Systems Report now to see how SAP TM compares.
2. Blue Yonder
Blue Yonder is a powerhouse in the transportation management space, offering an execution-focused TMS deeply embedded within one of the most comprehensive supply chain suites on the market. Its strength lies in serving enterprise clients—especially those in retail—with robust capabilities for global freight management, integrated planning, and execution. Unlike e2open, which builds around its own proprietary network, Blue Yonder leverages data partnerships to enhance its control tower and end-to-end visibility features, making it ideal for enterprises aiming to streamline complex, global supply chains.
However, Blue Yonder may not be the right fit for every business. SMBs or companies simply looking for a standalone TMS might find its suite excessive—both in cost and scope. Is your business prepared for a highly integrated system that covers both planning and execution? Or would a leaner, more focused TMS platform better suit your needs? Download the Ultimate Top 10 TMS Systems Report now to explore how Blue Yonder compares to other top contenders.
1. Oracle TMS
Oracle TMS stands out as a premier choice for large enterprises already invested in Oracle’s broader ecosystem, including ERP, RMS, and WMS. The platform’s developers built its transportation management capabilities for enterprise scalability, especially for industries like retail, distribution, and logistics where compliance, traceability, and tight financial system integration are critical. With native connectivity across the Oracle suite, businesses can expect streamlined data flows, enhanced operational visibility, and centralized control across supply chain functions.
That said, Oracle TMS may not suit every organization. Its high cost, complexity, and deep integration requirements make it better suited for companies with mature IT infrastructures and advanced global logistics needs. Are you an enterprise with demanding regulatory obligations and a need for full-suite integration? Or are you seeking a simpler, more agile TMS platform that can operate independently? Download the Ultimate Top 10 TMS Systems Report now to compare Oracle with other top platforms.
Conclusion
Much like other enterprise software categories, TMS systems come in various configurations. The suitability of a TMS system for a business largely depends on how it aligns with the enterprise architecture and business model.
If you’re considering a TMS system, it’s crucial to distinguish between systems provided by consulting firms and those by pure-play technology firms. Delve into your business model and enterprise architecture to evaluate which system aligns best with your needs. This list aims to offer potential options for your further evaluation with Independent TMS consultants.
Download the Full Report
FAQs
Which is the best TMS system?
Every TMS solution is crafted for a distinct purpose, industry, and transaction volume. What suits one company may not be the ideal fit for another. The key to finding the right TMS solution is conducting a comprehensive analysis of your specific needs and selecting a system tailored to your industry and transaction volume.
If a TMS system is not included in this list, should companies consider that as a potential solution?
Yes, most certainly. This list has used a specific criterion to make these recommendations. Just because a solution is not listed here doesn’t mean it might not be a great fit for you. Rather than making a decision purely based on rankings, read the fine print of the criteria and align that with your critical needs.
What implications should companies know about the factor of independence among TMS systems?
The factor of independence might matter if you are concerned that the publisher of the TMS system competes with their own network. Some carriers may not choose to participate because of this factor, and their rates might be potentially cheaper or more favorable than the most attractive quote available in the non-independent ecosystem.