High Tech & Electronics

Top 10 KPIs For Operations Managers

Operations managers are often responsible for all operational business processes from start to finish. From employees to suppliers, projects, jobs, and meetings, they strive to increase productivity, lower costs, and improve the quality of work. Their job is to empower their team of material planners, schedulers, estimators, warehouse workers, field service technicians, consultants, quality managers, maintenance staff, and laborers with relatable information. 

The KPIs for operations managers would always differ based on their responsibilities, the size of the organization, and the industry. Operations management could be as diverse as managing tactical roles such as logistics to strategic roles such as procurement or marketing. Despite being so diverse, weak operations management can lead to weak sales and operations planning, which might, in turn, lead to operational disruptions and inferior customer experience. So, which KPIs for operations managers are the most relevant to ensure streamlined operations?

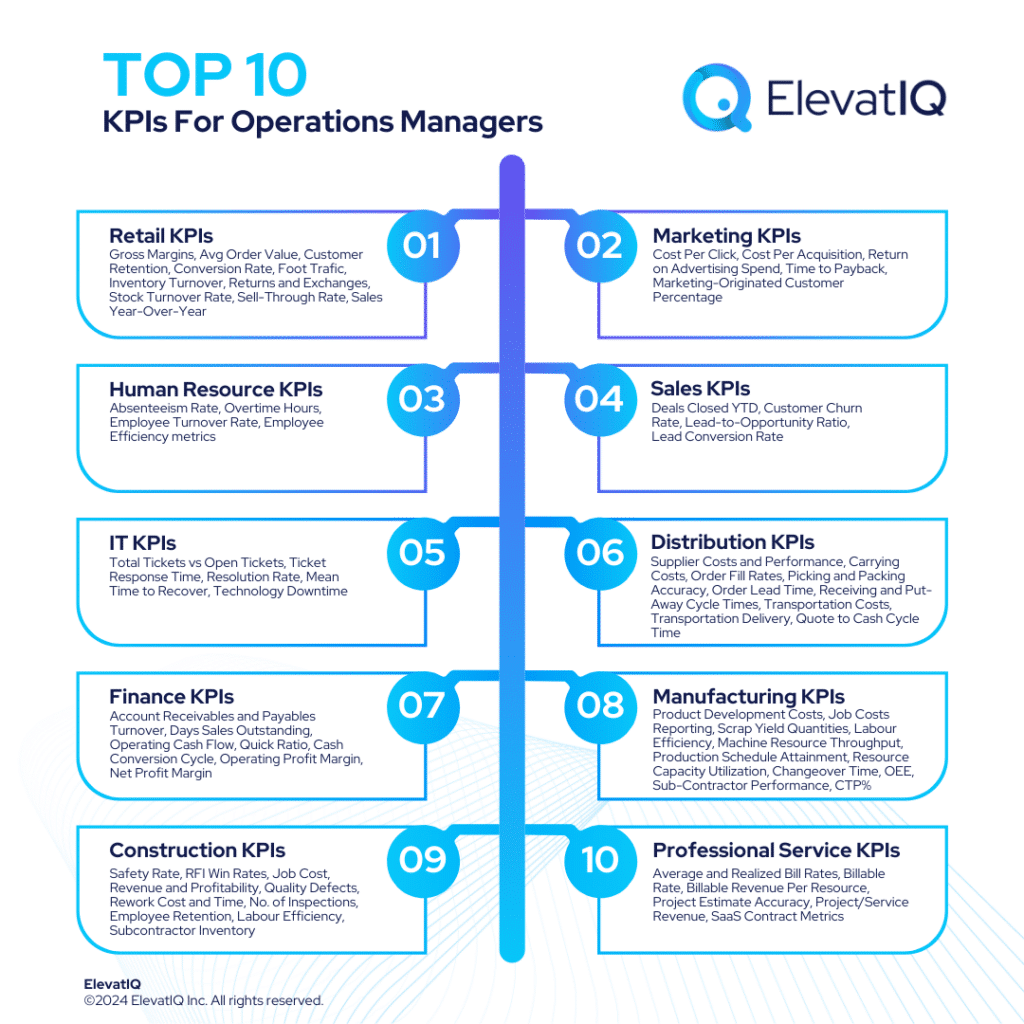
Operations managers are often tasked with harmonizing diverse functions spanning marketing, retail, human resources, sales, distribution, IT, finance, manufacturing, construction, and professional services. Here is the examination of the top 10 KPIs for operations managers based on each company department. This discusses ten departmental KPIs for operations managers: retail, marketing, human resources, sales, IT operations, distribution, finance, manufacturing, construction, and professional service operations KPIs, respectively. These KPIs serve as instruments, finely tuned to provide chaotic insights into the efficient, effective, and overall healthy operational facets.

Retail KPIs For Operations Managers

1. Gross Margins 

Gross margins are critical components of retail KPIs for operations managers. It represents the percentage difference between the revenue generated from sales and the cost of goods sold (COGS). This means it measures the profitability of each product or service. 

A high gross margin indicates that a significant portion of revenue is retained after covering the production or acquisition costs. Thus, signaling healthy financial performance. On the contrary, a low gross margin suggests that a substantial portion of revenue is consumed by the cost of goods sold, potentially impacting overall profitability. 

Formula: Gross Margin Percentage=[(Total Revenue−Cost of Goods Sold)/Total Revenue]×100.
Top 10 KPIs For Operations Managers

2. Average Order Value

Average order value provides insights into the average amount customers spend per transaction. AOV is calculated by dividing the total revenue generated by the number of orders. This metric is a valuable indicator of consumer purchasing behavior, reflecting the effectiveness of a company’s sales and marketing strategies. 

A high AOV suggests that customers are making more valuable transactions, indicating a successful upselling or cross-selling approach. Conversely, a low AOV may signal the need for strategic adjustments to encourage customers to add more items to their carts. Operations managers keen on maximizing revenue and profitability should closely monitor AOV. They can utilize the insights gained to refine sales tactics, enhance customer experience, and optimize pricing strategies.

Formula: AOV= Total Revenue/Number of Orders

3. Customer Retention 

Customer retention measures the ability of a business to retain its existing customers over a specific period. This metric is a testament to the loyalty and satisfaction of customers. It reflects the effectiveness of a company’s products, services, and overall customer experience. 

A high customer retention rate indicates a strong and loyal customer base, highlighting successful customer relationship management strategies. Conversely, a low retention rate may signal dissatisfaction or a lack of engagement, prompting operations managers to investigate and implement strategies to improve customer satisfaction and loyalty. Armed with this metric, operations managers can proactively shape strategies to enhance customer engagement, foster brand loyalty, and drive sustained business growth.

Formula: Customer Retention Rate = (Number of Customers at End of Period - Number of New Customers Acquired During Period)/ Numbers of Customers at Start of Period

4. Conversion Rate

Conversion rate measures the percentage of website visitors or potential customers who take a desired action, such as making a purchase. It serves as a critical indicator of the effectiveness of a company’s sales and marketing strategies in turning potential customers into actual buyers. 

A high conversion rate suggests that a significant portion of visitors is engaged and motivated to complete a transaction, reflecting the success of the company’s efforts in driving customer actions. Conversely, a low conversion rate may indicate inefficiencies or barriers in the customer journey, prompting operations managers to assess and refine the online shopping experience or marketing tactics.

Formula: Conversion Rate = (Number of Conversion/Number of Website Visitors or Potential Customers)×100

5. Foot Traffic and Digital Traffic

These two are essential retail KPIs for operations managers that provide insights into customer engagement across physical and online channels, respectively. Foot traffic refers to the number of visitors to a physical retail store, while digital traffic encompasses the online presence, measuring the number of visitors to a company’s digital platforms. These metrics indicate the level of interest and interaction customers have with the brand in different spaces. 

High foot traffic signifies a bustling physical store, indicating popularity and potential sales opportunities. Similarly, high digital traffic suggests a robust online presence, which can translate into increased digital sales and brand visibility. On the flip side, low foot traffic or digital traffic may signal a need for improved marketing strategies, enhanced customer experiences, or adjustments to product offerings. 

6. Inventory Turnover

Inventory turnover measures how efficiently a company manages its inventory by evaluating the number of times inventory is sold and replaced within a specific period. It is defined as the ratio of the cost of goods sold (COGS) to the average inventory during that period. This metric serves as a key indicator of inventory management effectiveness, providing insights into how quickly products are moving off the shelves. 

A high inventory turnover ratio typically indicates efficient inventory management, swift sales, and minimized holding costs. Conversely, a low inventory turnover suggests slow-moving stock, potential overstocking issues, and increased holding costs. Operations managers can leverage this metric to fine-tune inventory strategies, optimize stock levels, and ensure a healthy balance between product availability and financial efficiency. 

Formula: Inventory Turnover = Cost of Goods Sold (COGS)/Average Inventory

7. Returns and Exchanges

Returns and exchanges are integral components of retail KPIs for operations managers. It includes the volume of products customers bring back or exchange within a specified timeframe. This metric is a crucial measure of customer satisfaction, product quality, and overall operational efficiency. 

A high rate of returns and exchanges may indicate potential issues such as dissatisfaction, product defects, or discrepancies between customer expectations and delivered goods. Operations managers must scrutinize the reasons behind high return rates to address underlying concerns, optimize product quality, and enhance customer experiences. Conversely, a low rate of returns and exchanges generally signifies customer contentment and operational effectiveness, indicating that products meet or exceed customer expectations.

Formula: Return and Exchange Rate = (Number of Returns and Exchanges/Total Number of Items Sold)×100

8. Stock Turnover Rate

Stock turnover rate is a metric that assesses how efficiently a company manages its inventory by measuring the number of times stock is sold and replaced within a specific period. This KPI is a key indicator of inventory management efficiency, providing insights into how quickly a company can sell and restock its products. 

A high stock turnover rate generally indicates efficient inventory management, where products move briskly, reducing holding costs and potential obsolescence. Conversely, a low turnover rate may suggest overstocking or slow-moving inventory, leading to increased holding costs and the risk of product obsolescence. Operations managers can leverage this KPI to make informed decisions about inventory levels, ensuring a balance between meeting customer demand and optimizing operational costs.

Formula: Stock Turnover rate = Cost of Goods Sold (COGS)/Average Inventory Value


The 2025 Digital Transformation Report

Thinking of embarking on a ERP journey and looking for a digital transformation report? Want to learn the best practices of digital transformation? Then, you have come to the right place.

9. Sell-Through Rate

Sell-through rate quantifies the efficiency of a company in selling its inventory over a specific period. Essentially, it gauges how well a business is managing its stock levels and meeting consumer demand. 

A high sell-through rate indicates that products are moving off the shelves swiftly, signifying strong consumer interest and effective inventory management. Conversely, a low sell-through rate may suggest that products are lingering in stock, potentially indicating overstocking, pricing issues, or a lack of demand. Operations managers, by closely monitoring sell-through rate, gain valuable insights into inventory performance, enabling them to make data-driven decisions on pricing strategies, product assortment, and overall inventory management for optimal business outcomes.

Formula: Sell-Through Rate = (Number of Units Sold/Beginning Inventory) ×100

10. Sales Year-Over-Year

Sales year-over-year (YoY) is one of the crucial retail KPIs for operation managers that assesses the percentage change in a company’s sales performance for a specific period compared to the same period in the previous year. It provides a longitudinal perspective on sales trends, allowing operations managers to gauge the overall growth or decline in revenue. 

A positive YoY indicates sales growth, showcasing the effectiveness of business strategies and market demand. Conversely, a negative YoY suggests a decline in sales, prompting operations managers to investigate the root causes, adapt strategies, and make informed decisions to reverse the trend.

Formula: Sales Year-Over-Year = [(Current Year Sales - Previous Year Sales)/Previous Year Sales] ×100

Marketing KPIs For Operations Managers

11. Cost Per Click

Cost per click measures the average cost incurred by advertisers each time a user clicks on their online ad. CPC serves as a key metric for evaluating the efficiency and cost-effectiveness of online advertising campaigns. 

A high CPC may indicate that the cost of acquiring each click is relatively expensive, possibly requiring a reassessment of the advertising strategy or targeting parameters. Conversely, a low CPC suggests that the advertising campaign is cost-efficient, allowing the company to reach a broader audience for a lower investment. Operations managers can leverage this metric to optimize advertising budgets, refine targeting strategies, and ensure that marketing initiatives generate valuable user engagement at an optimal cost.

Formula: CPC = Total Advertising Cost/Number of Clicks

12. Cost Per Acquisition 

Cost per acquisition is one of the fundamental marketing KPIs for operations managers, serving as a metric to evaluate the average expense incurred in acquiring a new customer. CPA is a vital indicator of the efficiency and cost-effectiveness of a company’s marketing campaigns and strategies

A high CPA suggests that acquiring new customers is relatively expensive, possibly indicating inefficiencies in the marketing approach or the need for optimization. Conversely, a low CPA reflects a more cost-effective strategy for attracting new customers. Monitoring CPA allows operations managers to assess marketing efforts’ return on investment (ROI), guiding strategic decisions and resource allocations to optimize customer acquisition processes effectively.

Formula: CPA = Total Cost of Acquisition/Number of New Customers Acquired

13. Return on Advertising Spend

Return on advertising spend is one of the critical marketing KPIs for operations managers, serving as a quantitative measure of the revenue generated for every dollar spent on advertising. It is a powerful indicator of the effectiveness and efficiency of a company’s advertising campaigns. 

A high ROAS implies that the revenue generated significantly exceeds the advertising costs, suggesting a profitable and successful campaign. On the other hand, a low ROAS may indicate that the return on investment from advertising is not meeting expectations, prompting operations managers to reevaluate and refine their marketing strategies. Operations managers can utilize ROAS to optimize marketing budget allocation, identify successful channels, and make data-driven decisions to maximize the impact of advertising efforts on overall business profitability.

Formula: ROAS = Revenue Generated From Advertising/ Cost of Advertising

14. Time to Payback

Time to payback in marketing operations refers to the duration it takes for a company to recover the costs associated with acquiring a new customer. It is essentially a measure of the efficiency of marketing campaigns in terms of cost recovery. 

A low time to payback is favorable, signifying a swift recovery of customer acquisition costs and a quicker return on investment. Conversely, a high time to payback suggests a longer period for cost recovery, which may raise concerns about the effectiveness and sustainability of marketing initiatives. Operations managers can use this metric to assess the efficiency of marketing efforts, optimize campaign strategies, and ensure a more rapid and cost-effective return on investment.

Formula: Time to Payback = Customer Acquisition Costs/ Average Monthly Gross Margin per Customer

15. Marketing-Originated Customer Percentage

Marketing-originated customer percentage is a key performance indicator in marketing operations, providing insights into the percentage of customers that can be attributed to marketing efforts within a specific period. It serves as a valuable measure of the effectiveness of marketing campaigns in driving customer acquisition. 

A high marketing-originated customer percentage indicates that a significant proportion of new customers were influenced by marketing strategies, showcasing the success of marketing campaigns in attracting and converting leads. On the other hand, a low percentage suggests a need for adjustments in marketing strategies to enhance their impact on customer acquisition. Operations managers can leverage this KPI to gauge the return on marketing investments, refine campaign strategies, and optimize resource allocation to bolster customer acquisition through effective marketing initiatives.

Formula: Marketing-Originated Customer Percentage = (Number of Customers Acquired Through Marketing/Total Number of New Customers) ×100

Human Resource KPIs For Operations Managers

16. Absenteeism rate

The absenteeism rate is a metric that quantifies the frequency and extent of employee absences. It is defined as the percentage of scheduled work hours that employees are absent due to various reasons, such as illness, personal issues, or other unforeseen circumstances. The absenteeism rate provides valuable insights into workforce attendance patterns and employee engagement. 

A high absenteeism rate may indicate potential issues within the workplace, such as low morale, dissatisfaction, or health concerns, which can negatively impact overall productivity. Conversely, a low absenteeism rate is generally associated with a motivated and engaged workforce. Operations managers can utilize this KPI to identify trends, address underlying concerns, and implement strategies to promote a healthier and more productive work environment.

Formula: Absenteeism Rate = (Total Scheduled Hours of Absence/Total Scheduled Work Hours) ×100

17. Overtime Hours

Overtime hours refer to the additional hours employees work beyond their regular scheduled work hours. This metric is crucial in understanding human resource utilization and indicates the workload demands on a workforce. 

When overtime hours are high, it may signify increased workloads, tight deadlines, or understaffing, potentially leading to concerns about employee burnout, decreased morale, and increased labor costs. On the other hand, low overtime hours suggest efficient workforce management or a period of reduced demand. Operations managers utilize this metric to strike a balance between meeting operational demands and ensuring the well-being and productivity of the workforce. 

Formula: Overtime Hours = Total Hours Worked - Scheduled Work Hours 

18. Employee Turnover Rate

Employee turnover rate quantifies the percentage of employees who leave a company within a specific timeframe. This metric serves as a key indicator of workforce stability and organizational health. 

A high turnover rate may suggest issues such as dissatisfaction, lack of engagement, or inadequate workplace conditions, potentially impacting overall productivity and morale. On the other hand, a low turnover rate typically signifies a stable and content workforce, reflecting positive workplace culture and effective talent management. Operations managers, armed with insights from this metric, can implement targeted strategies to reduce turnover, enhance employee satisfaction, and foster a more resilient and engaged workforce.

Formula: Employee Turnover Rate = (Number of Employees Departed/Average Number of Employees) ×100

19. Employee Efficiency Metrics

Employee efficiency serves as an invaluable KPI for operations managers, providing a comprehensive understanding of workforce productivity. These metrics include:

  • Average time to complete a task
  • Percent of tasks completed within goal time
  • Error rate 
  • Revenue per employee
  • Volume of simultaneous task
  • Resolution rate

Sales KPIs For Operations Managers

20. Deals Closed YTD

Deals closed year-to-date provides a quantifiable measure of the total number of business deals successfully finalized within a given period, typically from the beginning of the year until the present moment. This metric clearly indicates a sales team’s effectiveness in converting leads into actual revenue-generating transactions

A high number of deals closed YTD signals a robust and proactive sales effort, showcasing the team’s ability to navigate the sales pipeline and capitalize on opportunities. Conversely, a low number may suggest potential challenges or inefficiencies in the sales process, prompting operations managers to assess and refine sales strategies. Operations managers leverage this KPI to gauge the overall health of the sales function, set realistic targets, and implement targeted improvements to optimize deal conversion rates and, ultimately, drive revenue growth.

21. Customer Churn Rate

Customer churn rate is a critical sales operations KPI that quantifies the percentage of customers who discontinue their relationship with a business within a given period. This metric serves as a key indicator of customer attrition and the overall health of a customer base. 

A high churn rate typically suggests issues with customer satisfaction, service quality, or competitive pressures, signaling potential revenue loss. Conversely, a low churn rate indicates a stable and satisfied customer base, reflecting successful customer retention strategies. Operations managers can utilize the churn rate to identify patterns, understand the reasons behind customer departures, and implement targeted measures to enhance customer satisfaction and loyalty. 

Formula: Customer Churn Rate = Number of Customers Lost During a Period/Number of Customers at the Start of the Period) ×100

22. Lead-to-Opportunity Ratio

The lead-to-opportunity ratio is a key performance indicator in sales operations to assess the efficiency of converting leads into qualified opportunities. A high lead-to-opportunity ratio suggests a successful lead generation and qualification process, indicating that a substantial percentage of leads are translating into potential revenue-generating opportunities. 

Conversely, a low ratio may imply inefficiencies in lead nurturing or qualification, signaling the need for improvements in the sales process to enhance conversion rates. Operations managers in sales can leverage this KPI to refine lead management strategies, optimize marketing efforts, and ensure a streamlined conversion pipeline, ultimately contributing to increased revenue and business success.

Formula: Lear-to-Opportunity Ratio = (Number of Opportunities Created/Number of Leads Generated) ×100

23. Lead Conversion Rate 

Lead conversion rate is a metric that quantifies the percentage of leads that successfully transition into paying customers. This metric serves as a key performance indicator, shedding light on the effectiveness of a company’s sales funnel and the success of its lead generation and nurturing efforts

A high lead conversion rate suggests a streamlined and effective sales process, indicating that a significant proportion of leads are progressing through the sales funnel to become valuable customers. On the contrary, a low lead conversion rate may signify inefficiencies or gaps in the sales strategy, prompting operations managers to reassess and optimize their lead management practices. Operations managers can leverage this metric to refine sales strategies, identify areas for improvement, and enhance overall sales performance, ultimately contributing to the company’s bottom line.

Formula: Lead Conversion Rate = (Number of Converted Leads/Total Number of Leads) ×100

IT KPIs For Operations Managers

24. Total Tickets vs Open Tickets

The number of total tickets vs open tickets provides insights into the efficiency of an IT support system. Total tickets represent the overall number of requests or issues raised by users, while open tickets are the subset that remains unresolved or in-progress. In essence, this KPI measures the ratio of resolved or closed tickets to the total number of tickets, offering a snapshot of the IT team’s responsiveness and effectiveness. 

A high ratio indicates a swift resolution of issues, suggesting a proficient and agile IT support system. Conversely, a low ratio may signify a backlog of unresolved issues, potential inefficiencies, or challenges in meeting user demands promptly. Operations managers can utilize this KPI to gauge the health of their IT support services, make informed decisions on resource allocation, and ensure that user concerns are addressed in a timely manner, ultimately contributing to enhanced operational efficiency and user satisfaction.

25. Ticket Response Time

The duration it takes for a support team to respond to user-reported issues or service requests is called ticket response time. It serves as a key indicator of the efficiency and effectiveness of an IT support system. 

A low response time is generally desirable, as it signifies a prompt acknowledgment of user concerns and a swift initiation of troubleshooting or problem resolution. Conversely, a high response time may indicate delays in addressing user issues, potentially leading to increased user frustration and a negative impact on overall service quality. Operations managers can leverage insights from this KPI to optimize IT support workflows, allocate resources efficiently, and enhance the overall user experience with IT services.

Formula: Ticket Response Time = [(Time of First Response - Time of Ticket Creation)/Number of Tickets]

26. Resolution Rate

Resolution rate is a critical IT operations KPI for operations managers that quantifies the effectiveness of resolving issues or incidents within a specified timeframe. This metric serves as a key performance indicator for IT support teams, measuring their efficiency in addressing and resolving technical challenges. 

A high resolution rate signifies a swift and effective response to issues, indicating operational excellence and customer satisfaction. On the other hand, a low resolution rate may suggest inefficiencies in the IT support process. This can potentially lead to prolonged system downtimes and dissatisfied end-users. Operations managers can utilize this metric to gauge the performance of their IT support teams and identify areas for improvement. They can also ensure the smooth functioning of IT operations in alignment with organizational goals.

Formula: Resolution Rate = (Number of Incidents Resolved/Total Number of Incidents Reported) ×100

27. Mean Time to Recover

Mean time to recover quantifies the average time taken to restore a system/service to normal functioning after an incident or outage. It serves as a key performance indicator for operations managers in the IT industry. It also offers valuable insights into the efficiency of incident resolution processes. 

A low MTTR indicates a swift and effective response to incidents, minimizing downtime and disruptions to IT services. Conversely, a high MTTR suggests a prolonged recovery process, potentially leading to increased downtime and adverse impacts on productivity. Operations managers use MTTR to assess the effectiveness of incident management, refine response strategies, and ensure timely service restoration. Ultimately, contributing to the resilience and reliability of IT systems within an organization.

Formula: MTTR = Total downtime/Number of Incidents

28. Technology Downtime

Technology downtime is when a system, network, or technology infrastructure is unavailable or not functioning as intended. It is the time when IT services or systems are offline, disrupting normal business operations. This metric is a key indicator of the reliability and resilience of an organization’s technological infrastructure. 

A high technology downtime indicates a greater frequency or duration of disruptions. It can potentially lead to decreased productivity, customer dissatisfaction, and financial losses. Conversely, a low technology downtime suggests a more stable and robust IT environment, ensuring seamless business operations. Operations managers can utilize this KPI to pinpoint areas for improvement in IT systems and implement preventive measures. It can also ensure the uninterrupted flow of technology-dependent processes, safeguarding the overall efficiency and reliability of the organization.

Formula: Technology Downtime Percentage = (Total Downtime/Total Time) ×100

Distribution KPIs For Operations Managers

29. Supplier and Carrier Costs

Supplier and carrier costs quantify the expenses associated with sourcing materials from suppliers and transporting them through various carriers. It reflects the financial efficiency of the supply chain. 

A high value may indicate increased costs, possibly due to inefficiencies in the supply chain, and calls for a reassessment of vendor relationships and transportation strategies. Conversely, a low value suggests cost-effectiveness in procurement and transportation, contributing to improved overall financial performance. Operations managers can utilize this KPI to negotiate better terms with suppliers and carriers, optimize logistics, and ultimately reduce overall distribution expenses.

Formula: Supplier and Carrier Costs = Total Procurement Costs + Total Transportation Costs

30. Supplier and Carrier Performance

Supplier and carrier performance gauges the effectiveness of both suppliers and carriers in meeting delivery and quality expectations. This KPI is a critical measure of reliability and consistency in the supply chain. 

A high score indicates a dependable network, ensuring timely and quality deliveries. On the contrary, a low score may signal disruptions or inconsistencies, prompting operations managers to reassess and potentially diversify their supplier and carrier base. Operations managers can utilize this KPI to identify underperforming partners, negotiate improvements, and ensure a smooth and reliable flow of goods. 

31. Inventory Turns and Carrying Costs

Inventory turns and carrying costs represent the number of times inventory is sold or used in a given period and the associated costs of holding that inventory. A high inventory turns value implies efficient inventory management, with goods swiftly transitioning from shelves to customers. 

On the flip side, a low value may indicate overstocking, leading to increased carrying costs. Operations managers can utilize these KPIs to refine inventory strategies, minimize holding costs, and enhance overall supply chain efficiency.

Formula: Inventory Turns = Cost of Goods Sold/Average Inventory Value

32. Order Fill and Back Order Rates

Order fill rate measures the percentage of customer orders that are fulfilled completely on the first attempt, while the back order rate tracks the orders that cannot be filled immediately and are delayed. 

High order fill rates signify efficiency and customer satisfaction, while high back order rates may indicate inventory shortages or inefficient order processing systems. Operations managers can utilize these KPIs to optimize inventory levels, improve order processing, and enhance customer service. 

Formula: Order Fill Rate = Number of Order Filled/ Total Number of Orders

33. Picking and Packing Accuracy

Picking and packing accuracy assesses the precision in selecting and preparing items for shipment. A high accuracy rate suggests a well-organized warehouse and order fulfillment system, reducing the likelihood of errors and customer dissatisfaction

Conversely, a low accuracy rate may lead to order discrepancies and additional costs for corrections. Operations managers can utilize this KPI to identify areas for improvement in warehouse processes, implement training programs, and enhance overall order accuracy. 

34. Order Lead Time 

Order lead time measures the time it takes from order placement to delivery, encompassing various stages. Short lead times indicate operational efficiency and customer responsiveness, while extended lead times may result in customer dissatisfaction and increased operational costs. Operations managers can utilize this KPIs to streamline processes, optimize workflows, and improve overall supply chain agility.

35. Receiving and Put-Away Cycle Times

Receiving and put-away cycle times evaluate the efficiency of receiving and storing goods upon arrival. Short cycle times indicate streamlined processes, reducing delays in inventory availability. 

Prolonged cycle times, on the other hand, may result in operational bottlenecks and increased storage costs. Operations managers can utilize these KPIs to streamline receiving and storage processes, reducing bottlenecks and improving overall warehouse efficiency.

36. Transportation Costs

Transportation costs quantify the expenses associated with moving goods from suppliers to the distribution center and, eventually, to customers. High transportation costs may suggest inefficiencies or suboptimal route planning, impacting overall supply chain profitability. Operations managers can utilize this KPI to optimize transportation routes, negotiate favorable agreements with carriers, and reduce overall distribution expenses.

Formula: Transportation Costs = Cost per Mile x Total Miles Travelled

37. Transportation Delivery(SLA)

Transportation delivery (Service Level Agreement) measures the adherence to agreed-upon delivery timelines. High SLA compliance ensures reliability and customer satisfaction, while low compliance rates may lead to service disruptions and potential damage to customer relationships. Operations managers can utilize this KPI to monitor carrier performance, negotiate improved delivery terms, and ensure the timely arrival of goods. 

38. Quote to Cash Cycle Time

Quote to cash cycle time calculates the duration from the initial customer quote to receiving payment. A shorter cycle time indicates a streamlined order-to-payment process, contributing to improved cash flow. Conversely, a prolonged cycle time may result in delayed revenue recognition and increased working capital requirements. Operations managers can utilize this KPI to streamline sales and billing processes, reducing cycle times and improving overall financial performance.

Finance KPIs For Operations Managers

39. Account Receivables Turnover

Accounts receivables turnover is a finance operations KPI that gauges the efficiency of a company in collecting payments from customers. A high turnover indicates a swift conversion of receivables into cash, reflecting strong cash flow and effective credit management. 

Conversely, a low turnover may suggest potential issues in credit policies or difficulties in collecting payments. Operations managers can utilize this KPI to assess the effectiveness of credit and collection procedures, optimizing cash flow and maintaining financial stability.

Formula: Account Receivable Turnover = Net Credit Sales/ Average Accounts Receivable

40. Days Sales Outstanding

Days sales outstanding is a metric that quantifies the average number of days it takes for a company to collect payments after a sale has been made. It serves as a critical finance operations KPI, representing the efficiency of a company’s credit and collection processes. 

A lower DSO indicates faster cash conversion and efficient credit management, while a higher DSO may signify potential challenges in the accounts receivable process. Operations managers can utilize DSO to optimize cash flow, identify potential collection issues, and streamline credit policies.

Formula: Days Sales Outstanding = (Accounts Receivable/ Net Credit Sales) × Number of Days in Period

41. Operating Cash Flow

Operating cash flow is a finance operations KPI that measures the cash generated or used by a company’s core operating activities. It provides insights into a company’s ability to generate cash from its regular business operations. A positive operating cash flow indicates financial health, liquidity, and the capacity to cover operating expenses. 

Conversely, a negative operating cash flow may signify liquidity challenges. Operations managers can utilize this KPI to ensure there is sufficient cash to fund ongoing operations, invest in growth opportunities, and meet financial obligations.

Formula: Operating Cash Flow=Net Income+Non-Cash Expenses+Changes in Working Capital

42. Quick Ratio

The quick ratio also known as the acid-test Ratio, is a finance operations KPI that measures a company’s ability to meet its short-term obligations using its most liquid assets. It is a more stringent measure than the current ratio as it excludes inventory from current assets. 

A high quick ratio suggests strong liquidity and an ability to cover short-term liabilities promptly. Conversely, a low quick ratio may indicate potential difficulties in meeting short-term obligations. Operations managers can utilize this KPI to assess short-term liquidity and make informed decisions about managing current liabilities.

Formula: Quick Ratio = (Cash + Marketable Securities + Receivables)/ Current Liabilities

43. Accounts Payable Turnover

Accounts payable turnover assesses how efficiently a company manages its accounts payable by measuring the number of times a company pays its average accounts payable during a specific period. 

A high turnover suggests effective management of payables and efficient cash flow, while a low turnover may indicate potential liquidity challenges or delayed payments. Operations managers can utilize this KPI to optimize payment processes, negotiate favorable credit terms, and enhance overall financial efficiency.

Formula: Accounts Payable Turnover = Net Credit Purchases/ Average Accounts Payable

44. Cash Conversion Cycle

The cash conversion cycle measures the time it takes for a company to convert its investments in inventory and other resources into cash flow from sales. It reflects the efficiency of a company’s working capital management. 

A shorter cash conversion cycle is generally favorable, indicating swift cash generation. Conversely, a longer cycle may suggest inefficiencies in working capital utilization. Operations managers can utilize this KPI to optimize inventory levels, improve credit and collection processes, and enhance overall cash flow efficiency.

Formula: Cash Conversion Cycle=Days Sales Outstanding (DSO)+Days Inventory Outstanding (DIO)−Days Payable Outstanding (DPO).

45. Operating Profit Margin

Operating profit margin is a finance operations KPI that measures the profitability of a company’s core operating activities. It is expressed as a percentage and indicates the proportion of revenue that remains as operating profit after deducting operating expenses. 

A high operating profit margin suggests operational efficiency and effective cost management, while a low margin may indicate potential challenges in controlling expenses. Operations managers can utilize this KPI to assess the efficiency of core operations, identify cost-saving opportunities, and enhance overall financial performance. 

Formula: Operating Profit Margin = (Operating Profit/Net Sales) ×100

46. Net Profit Margin

Net profit margin measures the overall profitability of a company by expressing net profit as a percentage of total revenue. It provides insights into a company’s ability to generate profit after all expenses, including taxes and interest. 

A high net profit margin indicates strong financial performance, while a low margin may suggest challenges in controlling overall expenses. Operations managers can utilize this KPI to evaluate the overall financial health of the company, identify areas for cost optimization, and make strategic decisions to enhance profitability.

Formula: Net Profit Margin = (Net Profit/Net Sales) ×100

Manufacturing KPIs For Operations Managers

47. Product Development Costs and Time-to-Market

Product development costs and time-to-market in manufacturing operations KPIs refer to the expenditures incurred and the time taken to bring a new product from conceptualization to market availability. This KPI indicates the efficiency of the product development process, reflecting a company’s innovation speed and cost-effectiveness. 

A high value may suggest prolonged development cycles and increased costs, potentially impacting competitiveness. Conversely, a low value signifies swift development and cost control, enhancing market responsiveness. Operations managers can utilize this KPI to streamline innovation processes, optimize resource allocation, and align product releases with market demands.

48. Job Cost and WIP Reporting

Job cost and work-in-progress (WIP) reporting represent the total cost incurred for completing a specific manufacturing job and the ongoing value of work in progress. This KPI indicates the financial efficiency and progress of manufacturing processes, with a high value signaling potential cost overruns or delays. 

A low value implies effective cost control and timely job completion. Operations managers can leverage this KPI to manage production costs, improve resource utilization, and optimize workflow. 

49. Scrap and Yield Quantities and Costs

Scrap and yield quantities and costs measure the volume of defective or wasted products in comparison to the total produced, along with associated costs. This KPI reflects the efficiency of production processes and product quality. 

A high value indicates a high level of waste, which can result in increased costs and reduced profitability. Conversely, a low value signifies efficient production with minimal waste. Operations managers can utilize this KPI to identify areas for quality improvement, optimize production processes, and reduce costs. 

50. Manufacturing Labor Efficiency

Manufacturing labor efficiency is a KPI that gauges the productivity of labor in the manufacturing process. This KPI indicates how effectively labor resources are utilized in manufacturing. A high value suggests efficient use of labor, minimizing costs per unit. 

Conversely, a low value may indicate inefficiencies, leading to increased labor costs. Operations managers can leverage this KPI to optimize workforce management, identify training needs, and enhance overall production efficiency.

Formula: Manufacturing Labor Efficiency = (Actual Production Output/Standard Production Output) x 100

51. Machine and Resource Throughput

Machine and resource throughput in manufacturing operations KPIs measure the rate at which machines or resources complete tasks within a given time period. This KPI reflects the operational efficiency of machinery and resources. 

A high value indicates optimal throughput and resource utilization, contributing to increased productivity. On the contrary, a low value may signal bottlenecks or underutilized resources. Operations managers can use this KPI to identify areas for improvement, allocate resources effectively, and enhance overall production capacity. 

52. Production Schedule Attainment

Production schedule attainment is a KPI that assesses the extent to which actual production matches the planned production schedule. This KPI provides insights into operational reliability and adherence to timelines. 

A high value suggests a consistent and reliable production schedule, contributing to customer satisfaction. Conversely, a low value may indicate challenges in meeting production targets, potentially affecting customer relationships and order fulfillment. Operations managers can utilize this KPI to optimize production planning, improve resource allocation, and enhance on-time delivery performance. 

Formula: Production Schedule Attainment = (Actual Production Output/Planned Production Output) x 100

53. Resource Capacity Utilization

Resource capacity utilization measures the extent to which available resources are utilized in production. This KPI indicates the efficiency of resource allocation and utilization. 

A high value suggests optimal utilization, contributing to cost-effectiveness. On the other hand, a low value may indicate underutilized resources, leading to increased per-unit costs. Operations managers can use this KPI to optimize resource allocation, identify areas for improvement, and enhance overall operational efficiency.

Formula: Resource Capacity Utilization = (Actual production Output/Maximum Possible Production Output) x 100

54. Changeover Time

Changeover time is a critical manufacturing operations KPI that measures the time taken to transition from producing one product to another. This KPI indicates the efficiency of changeover processes and the ability to adapt to different production requirements swiftly. 

A high value suggests prolonged changeover times, potentially causing production delays and impacting overall efficiency. Conversely, a low value signifies quick and efficient changeovers, enhancing production flexibility. Operations managers can utilize this KPI to optimize production schedules, reduce downtime, and enhance overall operational agility. 

55. Overall Equipment Efficiency (OEE)

Overall equipment efficiency is a comprehensive manufacturing operations KPI that assesses the performance, availability, and quality of equipment in the production process. OEE provides a holistic view of equipment effectiveness, with a high value indicating optimal equipment performance. 

Conversely, a low value suggests potential areas for improvement, such as increased downtime or reduced production speed. Operations managers can use OEE to identify and address equipment-related inefficiencies, improve maintenance strategies, and enhance overall production effectiveness.

56. Sub-Contractor Performance

Sub-contractor performance is a KPI that evaluates the effectiveness and reliability of subcontractors engaged in the manufacturing process. This KPI indicates the impact of external contributors on overall operational success. A high value signifies dependable subcontractors contributing positively to production. 

In contrast, a low value may indicate challenges such as delays or quality issues introduced by subcontractors. Operations managers can utilize this KPI to make informed decisions about subcontractor relationships, optimize supply chain partnerships, and ensure consistent production quality.

57. Capable-to-Promise (CTP)%

Capable-to-promise is a manufacturing operations KPI that evaluates a company’s ability to commit to fulfilling customer orders based on current production capabilities. This KPI indicates how effectively a company can meet customer expectations regarding order fulfillment. 

A high CTP% value suggests a robust production system capable of accommodating customer demands. Conversely, a low value may indicate challenges in meeting order commitments, potentially affecting customer satisfaction. Operations managers can leverage this KPI to enhance production planning, optimize inventory levels, and improve customer order fulfillment.

Formula: CTP% = (Available-to-Promise/Total Demand) x 100

Construction KPIs For Operations Managers

58. Safety/Incident Rate

Safety/Incident rate is a crucial construction operations KPI that measures the frequency of safety incidents or accidents on a construction site. This metric is defined as the number of incidents (injuries, accidents, or near misses) per a specific unit of measurement. It is often expressed per 100,000 work hours. 

A low safety/incident rate is indicative of a safe work environment, emphasizing the success of safety protocols and measures. Conversely, a high rate may signal potential hazards, prompting operations managers to reassess safety procedures. Operations managers can utilize this KPI to prioritize and enhance safety measures. Also, ensuring the well-being of the workforce and compliance with safety regulations.

59. Request for Information Win Rates

Request for information(RFI) win rates assesses the success of winning contracts or projects after responding to requests for information. A high win rate indicates effective bidding strategies and a competitive edge in the market. While a low rate may signify areas that require improvement. Operations managers can utilize this KPI to refine bidding approaches, better understand market dynamics, and optimize resource allocation.

Formula: Request for Information(RFI) Win Rates = (Number of Projects Won/Total Number of RFIs Submitted) x 100

60. Job Cost, Revenue, and Profitability

Job cost, revenue, and profitability are vital construction operations KPIs that gauge the financial performance of construction projects. The total expenses incurred during a project are job costs, the income generated is the revenue, and profitability is the net profit derived from subtracting costs from revenue. 

High job costs relative to revenue can indicate financial inefficiency, while low profitability may signal unsuccessful project management. Operations managers can utilize these metrics to assess project financial health, and identify areas for cost optimization.

61. Quality Defects, Rework Costs and Time, Number of Inspections

Quality defects, rework costs and time, and number of inspections are interconnected construction operations KPIs. They measure the quality and efficiency of construction projects. On one hand quality defects represent deviations from project specifications. While rework costs and time quantify the resources spent on correcting defects. The number of inspections measures how frequently quality checks are conducted. 

Low quality defects, rework costs, and inspection frequency indicate efficient project execution. While high values may suggest the need for improved quality control. Operations managers can utilize these KPIs to streamline project processes, enhance quality control, and minimize unnecessary expenditures.

62. Employee Retention

Employee retention measures the percentage of employees who remain with the construction company over a specific period. High employee retention signifies a positive work environment, skilled workforce, and effective management. 

Conversely, low retention rates may signal issues with workplace satisfaction or leadership. Operations managers can utilize this KPI to implement strategies for talent retention. They can also foster a positive workplace culture, and address any underlying concerns.

Formula: Employee Retention Rate = (Number of Employee Retained/Total Number of Employees at Start of Period) x 100

63. Labor Efficiency/Utilization

Labor efficiency assesses how effectively labor resources are utilized on a construction project. High labor efficiency indicates optimal resource utilization, while low efficiency may suggest underutilization or inefficiencies in project planning. Operations managers can utilize this KPI to optimize workforce allocation, improve project scheduling, and enhance overall labor productivity.

Formula: Labor Efficiency = (Actual Labor Hours Worked/Available Labor Hours) x 100

64. Subcontractor Inventory

Subcontractor inventory is a construction operations KPI that evaluates the availability and efficiency of subcontractors for construction projects. It is defined as the number of qualified subcontractors available for hire at any given time. 

High subcontractor inventory indicates a robust network of qualified subcontractors, facilitating flexibility in project staffing. On the other hand, a low inventory may lead to delays and increased costs. Operations managers can utilize this KPI to ensure a reliable pool of subcontractors, manage project timelines effectively, and mitigate risks associated with subcontractor availability. 

Professional Service KPIs For Operations Managers

65. Average and Realized Bill Rates

Average bill rate represents the average price charged for professional services, while realized bill rate is the actual revenue generated per billable hour. These metrics provide insights into the pricing structure’s effectiveness and how well it aligns with the market. High rates indicate value perception, but if too high, it may lead to client dissatisfaction. Low rates may attract clients, but it could impact profitability.

66. Employee Utilization/Billable Rate

Employee utilization/billable rate gauges the percentage of an employee’s time spent on billable client work. High utilization rates signify efficient resource allocation, but excessive rates may lead to burnout. Low rates suggest underutilization, potentially impacting revenue. Operations managers can optimize team productivity by balancing utilization rates.

67. Billable Revenue Per Resource

Billable revenue per resource measures the average revenue generated per service professional. A high figure indicates efficient resource utilization, while low figures may signify inefficiencies. Operations managers can use this metric to assess team productivity and adjust staffing levels to meet demand.

68. Project Estimate Accuracy

Project estimate accuracy reflects how closely initial project estimates align with the actual effort and cost. High accuracy signifies effective project planning, leading to client satisfaction and profitability. Low accuracy may result in cost overruns and strained client relationships.

69. Project/Service Revenue, Profitability, Deal Size, and Bid-to-Win Ratios

These encompass a suite of metrics evaluating project or service success. Revenue and profitability showcase financial performance, deal size indicates project scale, and bid-to-win ratios highlight the effectiveness of securing new projects. High values across these metrics indicate successful project management and business development.

70. SaaS Contract Metrics (ARR, ACV, and Churn)

Annual recurring revenue (ARR), Annual contract value (ACV), and churn rate are very important metrics for SaaS contracts. ARR and ACV showcase subscription revenue, while Churn measures customer retention. High ARR and ACV are favorable, while low Churn indicates satisfied customers. Operations managers can use these metrics to refine subscription pricing, improve service, and ensure long-term customer relationships.

Formula:

ARR = Monthly Recurring Revenue (MRR) x 12
ACV = Average Monthly Contract Value (MCV) x 12
Churn Rate = (Number of Customers Lost/Total Customers at Start of Period) x 100

Conclusion

In conclusion, operations managers are pivotal in steering the ship of diverse business functions, ensuring smooth sailing across marketing, retail, human resources, sales, IT, manufacturing, distribution, construction, professional services, and beyond. As we delve into the lists of KPIs for operations managers, it becomes evident that these metrics are the compass guiding them through the intricate waters of day-to-day work.

From the intricate details of retail operations, such as gross margins and inventory turnover, to the intricacies of human resources, including absenteeism rate and employee turnover, and extending to the critical domains of sales, IT operations, manufacturing, finance, construction and distribution, each KPI paints a distinct picture of efficiency, effectiveness, and overall operational health. These KPIs for operations managers act as instruments, finely tuned to provide insights into the complex landscape of operational facets.

+

ERP Implementation Failure Recovery

Learn how Frederick Wildman struggled with Microsoft Dynamics 365 ERP implementation failure even after spending over $5M and what options they had for recovery.

FAQs

Top 10 HCM Software In 2024

Top 10 HCM Software In 2024

HCM software holds a unique position in the architecture. Although some believe ERP should encompass HCM processes, regulatory challenges necessitate a dedicated HCM system. Smaller companies may initially rely on payroll software. However, as they grow, the complexity of HR demands sophisticated HCM solutions to navigate compliance and regulatory issues. Notably, the confidentiality requirements for HR data, encompassing compensation and personal information, pose significant challenges. The challenges are dictated by varying state and country regulations.

There’s a significant overlap between HCM, CRM, and ERP software, given their interconnected nature. Companies with union reporting requirements may need ERP processes embedded with employee data, while those with production scheduling needs require employee data integrated into shop floor processes. Certifications and availability are also crucial, ensuring the allocation of the right skill set for specific jobs.

Selecting an unsuitable HCM software that is not tailored to your industry can impact your enterprise architecture. This list aims to outline the pros and cons of the leading HCM software options available in the market.


The 2025 Digital Transformation Report

Thinking of embarking on a ERP journey and looking for a digital transformation report? Want to learn the best practices of digital transformation? Then, you have come to the right place.

10. UKG Ready

UKG Ready stands out among the top HCM software for SMBs, suitable for global organizations with basic HCM needs. Positioned between smaller solutions like BambooHR and ZohoHR and larger ones like Workday and SuccessFactors, UKG Ready offers a more accessible adoption for smaller organizations. Unlike larger counterparts, it doesn’t require configuring enterprise-level approvals, making it user-friendly. Companies headquartered in the U.S., Canada, Mexico, the U.K., France, the Netherlands, Belgium, New Zealand, and Australia can leverage UKG Ready for employee support in over 85 countries.

However, UKG Ready may not suit larger organizations with specific needs like succession planning, flexible benefits, and intricate compliance reporting requirements.

9. Zoho HCM

Zoho HCM is tailored for SMBs in sectors like IT, media, education, healthcare, and finance, particularly advantageous for those already using other Zoho apps. With a budget-friendly licensing price, it’s accessible for startups and smaller companies, complemented by strong support for DIY usage.

Zoho HCM’s simplified design suits their business model but may not be ideal for industries with intricate reporting or compliance needs. Larger companies with complex benefits management requirements may find it lacking. Additionally, Zoho HCM supports around 20 languages, limiting its global reach compared to UKG Ready.

+

ECommerce Supply Chain Transformation

Learn how LockNLube transformed its inventory and supply chain challenges by consolidating over 20 systems.

8. Infor WFM

Infor WFM is tailored for larger manufacturing organizations with union workers, catering to industries like automotive, aerospace, hospitality, public sector, and healthcare. It addresses specific employee reporting requirements governed by OSHA and other relevant regulatory organizations in specific countries.

Infor WFM, being a relatively costly product, is not an ideal fit for SMBs. It is best suited for larger companies with a minimum revenue of $250 million and a substantial workforce. The solution is particularly advantageous for organizations already utilizing Infor products like Infor LN or M3, as it seamlessly integrates with them. This integration facilitates the embedding of employee data into service and procurement scheduling workflows.

7. Ceridian Dayforce HCM

Ceridian Dayforce HCM is designed for SMB companies in manufacturing, retail, hospitality, the public sector, and healthcare. While it shares similarities with Infor WFM, Dayforce is more tailored for smaller organizations with a significant focus on blue-collar and hourly workers.

The solution lacks advanced features like benefits management, what-if scenarios, and succession planning, making it unsuitable for companies needing intricate approval processes or robust security workflows.

6. ADP Vantage HCM

ADP Vantage provides an integrated suite featuring HR Payroll, Workforce Management, Benefits, Recruiting, and Talent Management. Tailored for large enterprises with 1000+ employees, it is particularly advantageous for those already using ADP for payroll, offering separation of duties and accommodating various management layers.

For smaller companies, setting up and maintaining ADP Vantage can be complex, given the additional overhead of separation of duties. Communication issues among different modules, particularly between benefits management and payroll, can pose challenges for real-time interactions, as reported by our customers.

+

M&A ERP Integration Failure Rescue

Learn how Pride Sports struggled with Supply Chain and inventory allocation issues, as well as operational disruptions due to poorly planned M&A integration and ERP transformation project.

5. BambooHR

BambooHR, geared towards SMBs with basic HCM needs, competes closely with ZohoHR. Both target similar industries and startups with smaller HR departments and limited implementation budgets. With a total implementation cost as low as $3-5K, BambooHR provides support directly from Bamboo HR or through one of its partners.

The solution has limited reporting capabilities and may necessitate add-ons for advanced features like time clocks. In contrast, more advanced products such as Ceridian offer these capabilities out-of-the-box.

4. UKG Pro

UKG Pro, the flagship product in the UKG portfolio, caters to mid-large organizations with a need for enterprise workflows, separation of duties, and comprehensive workforce management. It seamlessly integrates with UKG Dimension products for advanced workforce management, positioning itself as a full-suite product akin to Workday, SAP SuccessFactors, and Oracle HCM. With native localization in over 100 countries, it eliminates the need for add-ons or partner-provided functionality to support diverse global requirements.

UKG Pro faces a challenge in its ecosystem with a limited number of available partners for product support, especially when compared to industry counterparts like Workday, SAP SuccessFactors, and Oracle Cloud HCM.

3. Oracle Cloud HCM

Designed for larger enterprises with complex management structures and approval flows, Oracle Cloud HCM is ideal for industries like technology, media, telecommunications, and healthcare. It offers additional advantages for organizations already utilizing other Oracle products, such as Oracle Cloud ERP. 

Despite its strengths, Oracle Cloud HCM presents challenges, particularly with its user interface, which relies on legacy products like Taleo. Smaller companies may find its complex workflows and data setup overwhelming. Moreover, it may not be the optimal choice for industries employing blue-collar workers, emphasizing the importance of considering these factors when evaluating the solution.

+

ERP Implementation Failure Recovery

Learn how Frederick Wildman struggled with Microsoft Dynamics 365 ERP implementation failure even after spending over $5M and what options they had for recovery.

2. Successfactors

Tailored for enterprises, the SuccessFactors HXM suite is an ideal choice for companies utilizing other SAP products, notably SAP S/4 HANA. Boasting support for 43 languages and over 45 localizations, it provides a holistic solution. With a dynamic ecosystem of consultants, it meets the varied requirements of manufacturing and trade-related industries, presenting a compelling option for businesses deeply rooted in the SAP ecosystem.

SAP SuccessFactors seamlessly integrates with other enterprise-grade SAP products like Qualtrics for comprehensive employee experience workflows. However, its extensive capabilities and costs might be overwhelming for smaller companies.

1. Workday

Workday caters to enterprise-level companies requiring intricate management workflows, particularly in complex hire-to-retire and benefits compensation processes. Its strength lies in industries like technology, media, telecom, insurance, and financial services, aligning with sectors where Salesforce is prominent. Workday is frequently deployed alongside Salesforce, FinancialForce, and ServiceNow to address comprehensive IT management and workflow automation needs. A key advantage of Workday is its cloud-native UI and seamless integration with other suite products, including EPM and Financials.

Despite its strengths, Workday Financials is not always a fully matured product and is sometimes overpromoted by its partners, leading to instances of failed implementations. Success with Workday requires careful selection and expertise in enterprise architecture.

Final Words

Given the variations in labor laws across states and countries, selecting and implementing HCM products demands a deeper level of expertise, such as that of independent ERP consultants. HCM workflows are often intricately linked with ERP, MES, and Service Scheduling modules. Consequently, HCM software selection can have wide-ranging implications on the overall enterprise architecture, potentially influencing operational efficiencies.

When incorporating HCM software into your architecture, it’s essential to clearly define roles and responsibilities for each system interfacing with the HCM software. This list aims to assist you in shortlisting potential options that align with your architecture needs.

FAQs

Top 10 Digital Transformation Roles

Top 10 Digital Transformation Roles

Looking for an ERP consultant who might be able to answer every question you might have? Well, unfortunately, just like different skill sets exist in a house construction project, ERP projects are no different with their need for digital transformation roles and skill sets. In fact, at a much bigger scale. Also, the more components you have in your architecture, the more skillsets you might require. Because the underlying technologies may be different, and they require years of training and specialization – to hit the ground running from day one, as that would be the expectation from ERP consultants.

Additionally, their educational backgrounds vary. The person who studied Supply Chain is likely to be deeper in the Supply Chain role. The same could apply to accounting and sales processes as well. A weaker chain (or an inexperienced resource) might slow down the whole project as they would need to be coached at every step of the way. Think of coaching basic ERP concepts such as the difference between a receipt and a voucher – and their implications on the process if interchanged. Their decision-making might not be sound either, which might have catastrophic consequences for the project.

Top 10 Digital Transformation Roles - List

So, understanding the importance of each of the digital transformation roles is critical for the success of your digital transformation initiatives. Most digital transformation initiatives fail because of a missing skillset. Or assigning unqualified resources to crucial positions. This is especially important for key cross-functional roles such as project manager or sponsor. These roles are typically more critical than the others, such as subject-matter experts. This list will help you understand the different digital transformation roles that might be required for your unique project.


The 2025 Digital Transformation Report

Thinking of embarking on a ERP journey and looking for a digital transformation report? Want to learn the best practices of digital transformation? Then, you have come to the right place.

10. Change Management Consultant

The change management consultant drives the entire change management process (and is among one of the most critical digital transformation roles). It starts with the identification of change, creating a business case to justify the change, exploring several change initiatives, and finally, implementing and monitoring changes. Depending on your budget, you might hire a dedicated change consultant or work with an independent ERP consultant. The independent consultants might bundle change management offerings along with their ERP selection, implementation, and integration expertise. 

Irrespective of the approach, change management is absolutely essential for the success of your technology initiatives. The technical vendors (and your internal teams) will struggle with change management due to the “power struggle.” So an external change management consultant is recommended. Depending upon the structure of your organization (and the scope of this role), you might need up to 20-25% of their time allocated to the project. With more involvement during the pre-selection phase, as well as the training phase.

9. Best-of-breed Apps and Add-on Experts

The role of best-of-breed apps and add-on experts is to provide the functional and technical expertise of these add-on products. Most ERP consultants are unlikely to have depth with each add-on or application. 

So you might need at least part-time resources that are familiar with these apps. The more apps you have in your architecture, the more skill sets you might require. And the more part-time resources you are likely to have as part of your project, the harder the scheduling will be, driving the overall costs of the project. Depending upon the structure of your organization (and the scope of this role), you might need a couple of hrs of their time as and when needed. Since these resources could be a true bottleneck to the project planning, you might want to pre-allocate some of their capacity. Or identify areas where their input might be required early in the process to ensure that they are not a showstopper for the project.

8. ERP Integration Consultants

Most ERP applications are huge in size and have thousands of tables and modules. The traditional ERP consultants are divided into two streams: functional and technical. ERP technical consultants specialize in Windows and proprietary database programming for that application. Also, traditional ERP applications were not service-oriented architecture-based. So, ERP consultants didn’t have as strong integration skills. The integration consultants specialize in API integrations, enterprise integration patterns, master data governance, and enterprise architecture

If you have multiple applications in your architecture, you will need specialized ERP integration consultants. Depending upon the complexity of your architecture and integration requirements, you might need part-time or full-time integration consultants. The integration consultants might also require time from ERP technical or functional consultants – to get help on cross-functional testing (as they might not be as deep functionally with each application in the architecture). So their availability can’t be the bottleneck, similar to other cross-functional roles mentioned below.

7. ERP Technical Consultants

ERP technical consultants are the technical experts of specific applications. Each product may have its own technical specialist. For example, technical consultants who focus on NetSuite might not have experience with Oracle Fusion Cloud. Or vice versa. The technical consultants are also extremely weak in their functional knowledge. And they can’t act as a functional consultant due to their limited knowledge. Their educational background is in software engineering, while the ERP functional consultants are likely to have an accounting, industrial engineering, supply chain, or mechanical engineering degree. 

+

ERP Optimization And Integration Architecture Development

Learn how Work Sharp fixed their broken ERP implementation that caused customer service issues and improved Supply Chain planning.

Even among technical consultants, there might be several skill sets, such as a report writer, form designer, DBA, or data migration consultants. They each have different expertise and skill sets. Depending upon the customizations expected, the need for technical consultants might vary. Heavier customization would typically require a higher allocation of technical consultants. However, technical consultants might not be required for the entire duration of the project. Their need would be more critical during the development phase. Once the customizations stabilize, the functional consultants should be able to handle the project – without their help.

6. ERP Functional Consultants

ERP functional consultants specialize in specific functional areas. The larger the products, the more complex the functional processes are likely to be. And the more consultants you are likely to need. For example, Smaller systems such as NetSuite or Acumatica may require only one functional consultant. Systems such as SAP S/4 HANA, Oracle ERP Cloud, and Microsoft Dynamics F&O, on the other hand, may require several functional consultants with a specialization in each functional area, such as accounting, supply chain, manufacturing, sales, etc.

Depending upon the complexity of your project, you might need full-time or part-time functional consultants – to test the configurations and resolve functional issues. Their role will also be to assist the principal functional/technical consultant (and project manager) with research and recommendations. Their role would be relevant during the implementation phase, with minimal involvement during the pre-selection phase.

5. Vendor- and Solution-agnostic ERP Consultant/Enterprise Architect/Principal Functional Consultant

Just like you need architecture for your home or kitchen, you also need for your software and IT applications. Architecture is a blueprint that clearly describes the boundaries of each system and its role in enterprise architecture. It also describes the interaction flows, with a clear agreement between data producers and custodians. Finally, it defines the model for reconciliation between different systems – should there be a conflict among systems.

Most teams and vendors are likely to create architecture from their perspective. And this often results in application silos, duplication of efforts, overengineering of components, and data issues. This one is perhaps among the most critical digital transformation roles for your project. Some independent ERP consultants might be able to include this role along with their change management expertise. However, an external consultant is recommended for this role. Depending upon the complexity of your architecture, you might need at least a part-time resource who acts as the advisor or oversees the overall process. This role is the longest-serving role of the ERP project, starting from the beginning of the project to the post-implementation phase.

4. Internal Subject Matter Experts

These subject matter experts should be the focus of your implementations. Why? Because they need to drive the training and evangelize the change for their internal teams. It’s critical that they appreciate and embrace the new platform. These are your internal operational users (such as supply chain managers, ops managers, and sales managers) who have the most depth in the business processes. They provide crucial details that strategic business process owners need to make key decisions. 

You need to allocate at least 10-20% of their time for the entire project. And involve them during the selection, process re-engineering, solution design, UAT, and training. 

3. Internal Business Process Owners

These are your business processes executives such as VP of Sales, VP of Ops, VP of Engineering, VP of Supply Chain, and VP of Finance who are responsible for making crucial decisions for their respective functions. 

They work in conjunction with subject matter experts and make decisions with a strategic perspective in mind. You will need their few hours allocated every week to be part of weekly demos and monthly steering committee meetings, along with any detailed meetings that may require their input for the to-be state.

2. ERP Project Manager

The ERP project manager is perhaps the second most critical role in your transformation. And ideally must be served by controllers, VP of Finance, CFOs, and sometimes by the CEOs for smaller organizations. They might hire a project coordinator to hand off some of the operational responsibilities if they are too busy with their day jobs. 

+

ECommerce Supply Chain Transformation

Learn how LockNLube transformed its inventory and supply chain challenges by consolidating over 20 systems.

This person is responsible for driving the project and keeping the project under budget and on time. This person must be comfortable negotiating with business process owners in the event of a conflict among different functions. Depending upon the size of the organization, allocate either full-time or 50% to ensure he/she is not the bottleneck for the project.

1. ERP Sponsor

The ERP sponsor is either the CFO, COO, or CEO, depending upon the size of the organization. The role of the sponsor is to set the vision for the project, provide resources, set KPIs to measure success, and help business process owners make key strategic decisions. 

Their role is not to make decisions for them. But to ensure that the decisions are consistent with the original vision and the interests of all functions are equally represented in the architecture. The ERP sponsor must participate in the monthly steering committee meetings and will need a few hours of their time each month. 

Final Words

Building an ERP project team is an art and science, with the expertise to be able to foresee showstoppers before it’s too late. The issues could be related to the team or technology. They each impact the cost and scheduling of the project.

While you will get better with your team-building expertise and experience, don’t underestimate the importance of any of the roles mentioned on this list. The primary reason why most organizations struggle with digital transformation initiatives is that they underestimate the effort involved with these initiatives – and try to “outsmart” the process, which fires back more often than not. So be really informed with each of your decisions – as you build your core project team that is capable of delivering on your vision.

FAQs

Top 10 Recommendations for Digital Transformation in 2023

Top 10 Recommendations for Digital Transformation

Who would not like to find the “secret” recommendations for digital transformation? Unfortunately, with enterprise-wide transformation projects, there is no checklist that can be followed. These projects require careful preparation and alignment of several areas. And they all, collectively, drive the success of your digital transformation projects. 

Also, with enterprise transformation projects, technology alone can’t solve business issues for you. You will need to align the compensation structure along with KPIs and enterprise architecture. Also, even if you have invested in substantial efforts with your pre-selection and business process reengineering, things might fall off during the implementation phase unless you have controls in place for code, master data, and architecture review (and compliance).

Top 10 Recommendations For Digital Transformation - List

Finally, most departments typically try to pull the architecture in their direction. This often results in the “loudest” departments being more represented in the architecture. Implications? Both overengineering and under-engineering issues will cause a disjointed experience for users. And they might end up with siloed applications or spreadsheets – defeating the overarching purpose of transformation initiatives. Following these recommendations for digital transformation will set you up for a successful transformation project.


The 2025 Digital Transformation Report

Thinking of embarking on a ERP journey and looking for a digital transformation report? Want to learn the best practices of digital transformation? Then, you have come to the right place.

1. Reassess Your Current Architecture and Systems

People often forget that your architecture is more important with enterprise-grade transformations than the technologies used. While it might appear promising at the surface, new software very rarely would solve your business problems. But why? Because unless there is a clear alignment in current gaps and process changes, the new system might not be as effective. It might even cause disruptions to your current operational processes if not planned well. 

Your chances of success will be higher if you redefine a vendor-agnostic architecture tailored to current operational limitations. First, improvement opportunities with the current architecture were identified. Then, only if it makes sense, replace a system where it’s a clear misfit based on your business model and growth ambitions. Assessing your architecture requires deep subject matter expertise with your systems, processes, and data – in order to perform an informed assessment. This assessment helps understand if the changes would make sense for your architecture (and at the stage of your business).

2. Centralized Transformation, Change, and Budget Management

Due to the lack of perceived short-term benefits (and risks for business process leaders), enterprise transformation initiatives typically take the backseat. So what’s the solution? Form a centralized digital transformation team and allocate a corporate budget for enterprise-wide transformation. 

What else? Identify change opportunities that impact your current systems and processes. Manage them centrally. And Define the blueprint for each changeset and assess its impact. Anything else? Yes, prioritize them and design phases including release strategy, And then execute them based on feasibility. Recommendations for digital transformation such as this help your vision take the front seat and resolve conflicts easily.

3. Compensation and KPI design

Have KPIs that are not only departmental. However, they should be aligned with the strategic priorities as well. Most corporations focus on short-term results. And that comes at the expense of the lack of interest in long-term strategic investment and initiatives such as enterprise-wide transformation

Impact of the short-term mindset? It results in duplicated efforts across departments and information silos. These silos are typically counterproductive for the overall success and financial health of the organization.

4. Don’t Ask Your Technology Vendors to Define Your Enterprise Architecture

Your enterprise architecture is essentially your business model. While technology vendors such as SAP or Oracle and their resellers might provide great technical capabilities, they are experts at tools in their portfolio. Their role should be limited to defining system architecture once the other architecture has been well-defined. 

So, what are these other architectural pieces? Business, process, and data architecture. And they all must be designed in a technology- and vendor-agnostic fashion. Who can help with this design? Qualified consultants with multi-system and multi-ERP expertise are better positioned to offer recommendations for digital transformation architectural components and their interactions.

5. Invest in Pre-selection Phase

The software development lifecycle requires you to go through the four critical phases of software implementation. Namely, requirement, design, test, and implementation. While buying enterprise software can save you a ton of effort and risk, these phases are equally relevant even for enterprise software implementation. Sometimes, even more so. 

+

ECommerce Supply Chain Transformation

Learn how LockNLube transformed its inventory and supply chain challenges by consolidating over 20 systems.

The pre-selection phase identifies requirements and process states. It also provides visibility into the as-is and to-be workflows for each department. Then it helps focus on the right critical success factors along with identifying gaps and development efforts required.

6. Get help from Independent ERP and Digital Transformation Consultants

Most executives go through 3-5 digital transformation initiatives in their careers. So designing the state of the system and processes based on this limited experience would not provide enough data and sample size to learn the architectural best practices. And forecast the possibility of each decision. 

The independent ERP and digital transformation consultants work with many different businesses. And they have already seen the mistakes that you are likely to make with your next transformation. Are consultants too expensive? Hire them at least to vet your plans and mentorship if you are on a tight budget.

7. Don’t Let Developers/IT Managers or Functional Subject Matter Experts Design the Architecture

Designing an enterprise system is similar to engineering functions in manufacturing. How so? The skill set that might be good with operational execution might not be the best for strategic and engineering design. Also, the developers and IT managers typically don’t have the visibility and business background to be able to negotiate process changes with functional stakeholders. 

+

Omnichannel ECommerce Customer Experience Transformation

Learn how fashion retailer AKIRA built a digital roadmap and managed stakeholder expectations to transform its processes and systems.

The same applies to functional leaders. While they might know a lot from the business perspective, the technical perspective is equally important in assessing performance and process issues due to poorly coded and integrated processes. You need someone who has a deep background in designing enterprise-grade systems, along with deep business expertise and education

8. Try to Reduce the Amount of Code You Own

With custom software, you might own 100% of the code, whereas with an ERP implementation, you might own roughly 30%. This might include any customizations, home-grown integrations, or proprietary systems. While software development might appear cheaper on its surface, owning and maintaining code over time requires economies of scale. So unless the custom code is part of your commercial offering, owning it will always be more expensive. 

So are there any components that are better suited for internal ownership? Yes, the components that change frequently such as EDI integration. Or the ones that may require substantial manual inputs from business users during the processing of transactions. The rest of the components can easily be bought at a much cheaper price from enterprise software vendors.

9. Invest in Master Data Governance

Most organizations end up reimplementing the same ERP system at least 2-3 times even within 5-10 years of the upgrade cycle. Most times it’s the mismanagement of master data that is the culprit. Poor master data management often leads to ad-hoc processes, adoption issues, and the need for external systems. 

The successful management of master data requires clearly defined roles and responsibilities for each system. And functions controlling the data and its interaction flow. It also requires forming a centralized function responsible for designing and maintaining master data compliance. 

10. Be ready to “Kill Your Darlings”

Fragmented and siloed operations often result in proprietary applications. These applications might make sense in a siloed and fragmented architecture. But not in the context of enterprise architecture

+

ERP Optimization And Integration Architecture Development

Learn how Work Sharp fixed their broken ERP implementation that caused customer service issues and improved Supply Chain planning.

The legacy and proprietary applications might drive the customizations and additional unnecessary integration flows to accommodate their shortcomings. It might be cheaper to replace these proprietary systems and use components that might be pre-integrated with the new solution.

Final Words

There are no secrets to digital transformation. It’s the structured approach along with the alignment that makes or breaks ERP implementation. With the increased number of channels driven by customer experience, the importance of architecture can’t be underestimated.

The digital transformation initiatives were never meant to be this difficult. But they do require expertise and thoughtful execution. Also, cultural and process changes have a direct impact on digital transformation initiatives. By following these recommendations, you will be set up for success with your digital transformation initiatives.

FAQs

Top 15 Reasons For Digital Transformation Failure

Top 15 Reasons for Digital Transformation Failure

Most executives are afraid of digital transformation. And I don’t blame them–with the amount of undertaking required for such projects. Not to mention that it took a long time for companies to understand – that digital transformation projects are not meant to be technology projects (The initiatives that developers can code in their backyard. The ones that can provide a crystal ball that can solve all your business performance issues). In reality, digital transformation failure typically has more impact on your businesses than most other disruptions (Unless it’s a full nuclear war). So why are some projects more successful than others?

There are millions of variables that could be responsible for failure. Team. Technologies. Vendors. Project managers. Change Management. Also, with so many variables involved, everyone is likely to have their own theories. There is no clear consensus, which makes it confusing for first-time buyers. While it’s much harder to find why a specific digital transformation project may have failed, it’s much easier to analyze the successful ones. One thing that successful teams do differently is that they don’t underestimate the efforts involved with these projects. 

Top 15 Reasons for Digital Transformation Failure - Light

That’s probably the reason why the larger companies with multiple ERP implementations under their belt are likely to be more successful than the smaller companies. There are smaller companies that are likely to be successful as well. However, in their case, the executives must have experience leading multiple ERP implementations at larger companies. While this is one factor, there are more layers to what makes them successful (as per our study done with more than 200 executives suggests). Excited to review the results?

1. Misalignement in scope 

Misalignment in scope is perhaps the #1 reason for digital transformation project failure. Some people might blame the “invisibility” aspect of software development – to claim that there will always be surprises with software implementation. Also, there is a common misconception that there is no point in planning if there are going to be surprises anyway. Following this approach is an “extreme” thinking mindset where you don’t prepare for an exam – just because there might be a chance of failure.

+

ERP Implementation Failure Recovery

Learn how Frederick Wildman struggled with Microsoft Dynamics 365 ERP implementation failure even after spending over $5M and what options they had for recovery.

Software implementation projects require the same amount of engineering processes. As much as manufacturing or construction. Sure, there have been advancements in methodologies – such as agile – to uncover risks earlier. However, the fundamentals of software engineering still apply. They require careful analysis and design by qualified ERP consultants (the consultants that regularly implement for various industries and business processes).

Also, unfortunately, analyzing at “100K-foot” levels (the mindset that going too deep into technical analysis may be a waste of time) approaches aren’t good enough to be successful with these projects. It’s a careful balance of high and low-level needs. A balance that will help you find the scope with an iterative process and a scope that will likely not have any misalignments. Or surprises (Don’t we like surprises?).

2. Unrealistic Expectations

The only reason why unrealistic expectations lead to ERP implementation failure is to underestimate the amount of effort required. In fact, unrealistic expectations and misalignment in scope are so interdependent that they could be each other’s cause (Wait, what? Have I confused you enough yet?).

The root cause for unrealistic expectations is the “mindset” that maybe there is an easier way. Maybe the “consulting companies” are in the business of overcharging their customers. Maybe consultants have a tendency to overcomplicate things so they can make more money. While, as with any profession, there might be some bad apples out there, the issue is typically with the companies who don’t have enough experience under their belt in leading digital transformation initiatives.

The best way to mitigate such issues is to be patient with the process and do as much research as possible to understand the core issues. Also, recommended is not ignoring the advice of your consultants. The more implementation you have under your belt, the more conservative you will be with these projects. And the higher chances you will have of success with such projects. The only way to succeed is to be realistic (and extremely conservative) with these projects.


The 2025 Digital Transformation Report

Thinking of embarking on a ERP journey and looking for a digital transformation report? Want to learn the best practices of digital transformation? Then, you have come to the right place.

3. Inability to re-engineer processes (aligned with the capabilities of new system architecture)

Constructing a house based on how your old house appears today is likely to result in the same “old” house – with not much improvement (Isn’t that what we all want? The constructive ways of wasting our money? For all practical purposes, no!). Constructing an improved house requires you to have a deep reflection on the old house as well as the root cause of each issue you had in the old house. Along with the “mental model” (I prefer a blueprint on a piece of paper) of the new house based on your new needs. This task is way harder than you would think. 

+

ERP Optimization And Integration Architecture Development

Learn how Work Sharp fixed their broken ERP implementation that caused customer service issues and improved Supply Chain planning.

Being successful with it would require a solid knowledge of several different ERP systems and implementation experience in several industries. So, you have enough data points to identify the right model that will be successful, given the constraints of this new house. Without business process reengineering, companies mistakenly assume “old and broken” processes as their needs. And hand it over as requirements to the technical teams. 

Given the constraints, the technical team might spend months customizing these needs. And even after successful technical implementation, they might never work for users as they might deviate from the system’s optimal state. Skipping the crucial step of business process reengineering results in ERP implementation failure. Along with adoption and change management issues due to the limited understanding of the rationale for change.

4. Over-customization of the software

Most companies with limited experience with ERP implementation have a tendency to underestimate the effort involved in customizing software. The customization not only results in the core system’s sub-optimal performance. But it also causes user adoption issues due to the alteration of systems’ natural state.

Also, most organizations that may have promoted their developers to IT operations managers too early to a CIO role are likely to customize the software heavily (Also, they hate dollar conversations, which is perhaps the bread and butter for a CFO) The business rules in ERP are so nested that even if you implemented a feature successfully (for your own use case), it’s likely to break for other departments.

So, customization of software will always have a much higher chance of implementation failure. The best strategy to save an ERP implementation because of over-customization is to perform a thorough gap analysis during the selection and get recommendations from implementation architects in terms of the effort involved – in implementing each gap. If the effort seems too high, most likely, you have selected the wrong software. Or your process needs to be simplified further (You also have the option to pray. They always work with digital transformation). Thorough scrutiny and deep probing of each gap will help you understand that you are customizing only when it’s absolutely essential.

5. Usage of too many poorly written bolt-ons (impacting operational performance)

Most systems’ design assumes their natural state for optimal performance. While they all might allow customization, the system may have never been tested with the overlapping boundaries of add-ons. The add-ons might also be poorly written – and might cause performance implications.

There is also a misconception that no-code technologies can help you integrate anything and everything. Yes, that is true. But when it comes to mapping data flows and identifying sources of authority, the fewer variables you have in your model, the higher chances you would have with your digital transformation initiatives. (You want one thief to steal your money. So you kind of know who stole what)

Using too many add-ons is a major factor in digital transformation failure. This is due to the increased number of variables that are controlled by multiple vendors, their technologies, and release cycles. Having too many add-ons is a clear red flag that there might be better options out there. And a factor that you should watch closely while signing your software contract.

 6. Organizational change management

Underestimating the importance of change management results in digital transformation failure. But change management is typically the first symptom (Like a fever is an expression of inner rage) that you might notice regardless of the underlying issues that might be driving poor adoption. For example, change management issues could be a result of poor training, suboptimal system design, and workflows – or misfit technical systems. 

“Business consultants” with very little background in formal software engineering have a tendency to believe that you can solve all change management issues with superior training. Well, it’s almost like saying that you can solve all sales performance issues with the right “mindset.” Can you?

Sure, “mindset” and “training” play a huge role in change management. But it’s not just the training that is responsible for the success of digital transformation initiatives. It’s the synergy of systems, technologies, design, processes, and motivations that make digital transformation initiatives successful. But the most important factor for effective change management would always be the ability of change management consultants to work with the technical teams – to ensure that there is no misalignment in strategy and execution.

 7. Lack of maturity of enterprise architecture

The lack of maturity in enterprise architecture is a leading cause of digital transformation failure. Most SMB companies don’t even understand the number of components that might be included as part of the software contract. Just like manufacturing, a critical part can halt your product line, and a weak component of your “software BOM” could lead to digital transformation failure.

Irrespective of whether you buy or build – or how many ever add-ons you have in your architecture – enterprise architecture is extremely critical. The enterprise architecture encompasses four different perspectives: 1) business architecture 2) process architecture 3) data architecture 4) system architecture. 

When most companies think of enterprise architecture, they see it as a “technical” concept. But just like an org chart is to people, enterprise architecture is to systems. And the success of your enterprise architecture relies on having clear boundaries of systems and processes. Because they each play a role in defining cross-functional processes So not having a clearly defined enterprise architecture is the surefire way of failing your digital transformation initiatives.

 8. Poor governance of master data

Master data forms the foundation of your enterprise architecture. Without having a clear interaction model of each dataset, the systems are likely to have duplicated data in multiple systems. The inefficiencies caused by duplicate data and data silos lead to more fragmented systems. Ultimately causing even more data silos. Tracing data dependencies in your enterprise architecture might feel like a confused mouse in a maze.

Even developers and technical architects struggle to understand the concept of sources of truth. The most common misconception is about the multiple sources of truth. Some people believe that multiple sources of truth mean keeping duplicate data in multiple systems. Sure, are there any systems that can be implemented by completely decoupling data dependencies? Yes. But is that architecture going to be appropriate for every single dataset? Probably not. And most certainly not for the architecture containing financial systems and processes.

Implementing event-driven architecture with completely decoupled datasets works when the reliability of data is not as important a concern. Think of social media messages or error logs published by remote devices. What’s a big deal if we might lose an error or social media message? No big deal right? But with financial data where the books need to be reconciled to pennies, the reliability of data is extremely critical. And the data architecture that allows you a high degree of relatability and traceability is a crucial requirement.

 9. System selection gone wrong

Selecting appropriate systems requires you to have updated knowledge of architectural patterns – and several enterprise software categories, including ERP, HCM, CRM, and eCommerce. The software systems available in the market have extremely overlapping boundaries – with substantial duplication in code bases. And this is only going to get worse! Also, it is equally critical to have profound expertise and advanced knowledge of your industry and business model.

Without a comprehensive knowledge of systems and processes, your gap analysis is likely to miss critical gaps that command the highest amount of dollars — and lead to ERP implementation failure. Also, prior to investing in technology, you need to invest in defining the other three legs of the stool: 1) business architecture 2) process architecture 3) data architecture. Selecting a poorly fit system will lead to over-bloating of processes and systems, resulting in serious adoption issues. Don’t sign a software contract without performing an exhaustive search of all systems available in the market.

 10. Past results = Future success (With digital transformation initiatives)

You might never be proud of the first home that you bought. As you develop deeper recognition of your own needs, you are likely to do a lot more planning and “sketching” with your next purchase. The same principles apply to digital transformation. First-time executives are likely to be most optimistic about finding “cheaper” and “smarter” approaches to digital transformation (unfortunately, poker strategies don’t work very well with digital transformation initiatives). 

As you implement more systems, the deeper will be your analysis. And more conservative will be your approach. The conservative approach to system design and planning leads to digital transformation success. So make sure you don’t cut corners in hiring the right expertise to lead your digital transformation initiatives.

 11. Ability to work with technology vendors

Just like an engineer must be able to connect and relate with your shop floor workers, your ERP core team must be able to connect and relate with your developers and technical consultants. This relatability requires you to speak their language in the format they understand (and with digital transformation implementation, God will not translate for you). 

Not listening to their concerns or ignoring their advice with the attitude of “too much into weeds” will lead to ignoring critical issues that might have disastrous consequences on your enterprise architecture. They also require translating business vision and priorities into technical architectural components that will help them connect the dots. Several years of experience working with technology vendors helps in building the right rapport with technical teams – and leads to digital transformation success. 

 12. Poorly written test scripts (and the missing framework for test compliance)

Writing good test scripts takes years of practice. With ERP systems, it’s even harder. Because you need to segment the functionality that is pre-tested and provided by OEMs – from your custom configurations and customizations. To do this, you need to have a deep understanding of the core ERP functionality. And The more lines of code you own – the more testing you need (like the more money you own, the more stress you will have).

The main issues with enterprise-grade systems are data dependencies and the length of enterprise transactions. That makes documenting and tracking test cases and results much more difficult. It takes years of practice for ERP testers to identify the right test scripts. That will help uncover critical issues early in the process. And avoid showstoppers later in the release cycle. The showstoppers that typically lead to digital transformation nightmares.

 13. Uncontrollable issues

Because of the “invisibility” issue of software implementations, you will always find uncontrollable issues. However, it is the thorough planning and early detection of critical technical and process issues that help minimize uncontrollable issues. It is also the research that has gone into each issue to minimize the impact on time and budget.

But sometimes, finding a fine balance between the time required to perform research and the budgetary implications of showstoppers is key. Investing too much time in issues that might never surface may be a pure waste of time and resources. This is why consultants who have deep experience in executing large programs are better equipped to identify these issues much earlier in the process – and save digital transformation nightmares.

 14. Not having a dedicated internal skilled project manager

The most challenging part of a digital transformation project is the missing cross-functional link. Typically, in SMB organizations, the CEO has the most cross-functional understanding. And the only person who is qualified to negotiate with each department in executing or organization’s vision. The problem may be more difficult with organizations with multiple subsidiaries. 

And unfortunately, the CEO very rarely has time to get into the “weeds” of the project (who cares for a neglected weed anyways?). Or mediate conversations when there is a conflict among functional or BU leaders. This is where the project mangers’ role is absolutely critical for the success of the project. 

The project manager must have several ERP implementations under his/her belt and have a formal educational background in business or supply chain. Also, one of the most critical skills of a project manager is to be unbiased (except when it comes to preference for their coffee) and spend time working closely with executive teams. Hiring an intern or a “generalist” project manager with no formal background in Supply Chain and software engineering is a sure recipe for disaster.

 15. Treating digital transformation projects as a technical implementation

While the major component of digital transformation initiatives is technology, it alone can’t solve all your problems (with solitude, it’s independence; with digital transformation, it’s interdependence). It has to be the synergy of processes, data, organizational structure, compensation plans, and systems. 

+

Omnichannel ECommerce Customer Experience Transformation

Learn how fashion retailer AKIRA built a digital roadmap and managed stakeholder expectations to transform its processes and systems.

Treating your digital transformation project as a technical project typically leads to over-customization of workflows, overengineering of processes, and data siloes. They all lead to poor adoption – and, ultimately, digital transformation failure. Involving your business users from day one through the process of business process re-engineering will help them understand the technical challenges and articulate their needs in a technically feasible manner. This will also help forecast the challenges they might expect when they are live on a system.

Final Words

There are several factors that could lead to digital transformation failure. It’s never one vendor. Or a system. But one surefire way to fail your digital transformation would be – to underestimate the amount of effort involved with digital transformation and ignore the pre-selection phase. This sets the tone for how badly the digital transformation initiative will fire back. Because they always fire back unless carefully planned.

Digital transformation initiatives are like going for heart surgery. The first time will always be the most painful. As you get used to surgeries — and how to mentally prepare for the surprises with each one – hopefully, you won’t be as afraid with your next surgery.

FAQs

Top 15 Digital Transformation Trends in 2024

2023 didn’t turn out to be the year we expected. It was full of ups and downs. While some positive indicators suggest promise for 2024, ongoing uncertainty is anticipated until a potential interest rate decrease in H2 of the following year. This uncertainty is poised to directly influence digital transformation trends, leading CFOs to adopt a conservative approach in approving budgets for initiatives with uncertain short-term ROI.

Also, despite significant AI momentum, translating AI technologies into predictable business outcomes may require several years. The immediate impact of AI, however, is evident in content generation, potentially accelerating the adoption of digital channels. Companies previously hindered by expensive content barriers might swiftly embark on their digital journey, reshaping transaction processes and altering expectations from enterprise technologies.

Yet, the other side of AI could have a more pronounced impact on the enterprise software market. Policy changes that drive increased reporting requirements for companies, even those not in tech development. This may result in significant financial and reporting overhead, presenting opportunities for enterprise software and ERP vendors. Despite the potential drama, 2024 could take a positive turn if the market opens up in the second half of the year. So, what are the key digital transformation trends for 2024?


The 2025 Digital Transformation Report

Thinking of embarking on a ERP journey and looking for a digital transformation report? Want to learn the best practices of digital transformation? Then, you have come to the right place.

1. Artificial Intelligence-Driven Business Models

AI is reshaping business operations. Its immediate impact lies in content generation, fast-tracking digital channel adoption. Traditional industrial firms, slow to embrace digital, may now speed up due to lower content production barriers. This shift prompts the emergence of new discovery and search channels, necessitating a revamp of business models and processes.

Moreover, AI-related regulatory changes will heighten reporting and compliance needs, prompting system and process adjustments.


ERP Selection: The Ultimate Guide

This is an in-depth guide with over 80 pages and covers every topic as it pertains to ERP selection in sufficient detail to help you make an informed decision.

2. Measured Approach to Investments

The continued uncertainty through 2024 will drive a conservative outlook with long-term investments, especially digital transformation initiatives. CFOs are likely to scrutinize and potentially delay initiatives lacking immediate returns.

Anticipate impulsive software buys, especially for short-term-focused tech amid the conservative atmosphere. Result: potential long-term technical backlogs.

+

ERP Optimization And Integration Architecture Development

Learn how Work Sharp fixed their broken ERP implementation that caused customer service issues and improved Supply Chain planning.

3. Geopolitical Impact on Business Processes

In 2024, anticipate significant shifts in global political power affecting supply chains and markets. Changes in monetary and information flow will drive architectural and business process adjustments. Brace for regulatory announcements and policy decisions shaping information, currency, and monetary flow.

4. Decision-grade Data and Insights

The supply chain networks and AI models have never been more powerful. The increased access and collaboration of supply chain companies will allow companies to have access to decision-grade data to improve inventory forecasting and demand, increasing cash flow and providing enterprises with a massive competitive advantage over SMBs.

5. Supply Chain Networks and Visibility Platforms

With the tighter collaboration between supply chain networks, enterprises will have end-to-end traceability into the entire supply chain, which has never been possible before because of the fragmented tracking of different modes and geographical siloes. Companies that are mature with their core operational capabilities will likely have an edge over their competitors.

6. Increased Focus on Sustainability and ESG

ESG and sustainability will continue to be the focus for most governments and consumers. ESG and sustainability policy changes will drive reporting requirements, which most software vendors are likely to develop to take advantage of newer digital transformation trends. But brace for confusion; the architectural community is still figuring out the ESG and sustainability style guide.

+

ECommerce Supply Chain Transformation

Learn how LockNLube transformed its inventory and supply chain challenges by consolidating over 20 systems.

7. Continued Consolidation of Enterprise Suites

2023 saw the consolidation of several software categories primarily promoted by private equity to take advantage of the current economic cycle, where the short-term outlook is favored for long-term investments. 2024 will see even more consolidation of enterprise software categories, creating massive overlap and newer architectural patterns never seen before.

8. Increased Failures and Shifting Architectural Patterns

In a conservative short-term outlook, buying trends may favor short-term gains over long-term risks, like the rush to adopt SaaS without scrutinizing architectural implications from an enterprise perspective. Result? Tech backlogs grow, and failure rates spike.

9. e-Invoicing

In 2024, expect e-invoicing processes to level up. Countries may borrow successful models, while trailblazers refine their systems, sparking shifts in reporting needs and architectural patterns.

+

ERP Implementation Failure Recovery

Learn how Frederick Wildman struggled with Microsoft Dynamics 365 ERP implementation failure even after spending over $5M and what options they had for recovery.

10. Slowed M&A

Music is likely to be paused even in 2024 from the perspective of M&A, where the activity levels are likely to be lower. And since the M&A activity has a tighter correlation with ERP and digital transformation initiatives, the digital transformation industry is likely to see slowed deals. Also, because of the conservative outlook, most software vendors are likely to be conservative with their R&D dollars and innovation.

11. Increased Investments in Strategy and Change Management

The conservative outlook would trigger tighter due diligence of initiatives with questionable short-term outcomes, such as digital transformation, which will cause companies to invest in strategy and change management, as well as much tighter scrutiny of initiatives in a phased approach.

12. Tighter Collaboration of Tech Companies

The need for access to massive datasets to build accurate AI forecasting models will force rivals to collaborate for greater gains and not to be left behind. For example, The recent collaborative arrangement of Oracle with Microsoft. This was very common in the supply chain technology space, but now, even the other technology vendors are likely to have closer relationships.

13. Mature Cloud-native Technologies

Cloud technologies will continue to mature, and even the legacy vendors will soon be able to provide cloud-native experiences such as enterprise search or workflow traceability. The cloud versions will continue to catch up with their on-prem variants, and the R&D investments with on-prem versions are likely to slow down.

14. Industry 4.0 and Edge Computing

Industry 4.0 and edge computing will see continued acceleration and adoption, especially to acquire data that is needed for AI models. The AI-enabled capabilities with machines and edge devices will make it compelling for organizations to adopt industry 4.0 technologies and architecture at an accelerated pace.

15. OmniChannel Experience

The omnichannel experience will continue to receive attention, especially among headless technologies that provide a competitive edge. With AI-augmented content generation capabilities, providing omnichannel experience is likely to become cheaper and easier, helping brands penetrate digital channels faster.

Final Words

The year 2024 is expected to carry a level of uncertainty similar to that of 2023, leading CFOs to likely adopt a cautious approach to their expenditures. A potential catalyst for advancing the enterprise software market could be innovations powered by AI. Nevertheless, translating AI initiatives into tangible business outcomes may require time for companies to grasp fully.

For those contemplating digital transformation initiatives in 2024, allocate resources to a strategy aimed at mitigating financial and technical risks. Doing so will not only enhance your chances of securing the trust of financial executives but also guard against unforeseen challenges that may arise in the absence of such a plan.

Top 10 ECommerce Platforms In 2024

Top 10 ECommerce Platforms in 2024

While many associate digital eCommerce platforms with coupons scattered across websites, the scope of digital commerce extends beyond that perception. Even if your transactions don’t occur online, your website’s contact form serves as a digital commerce element, acting as a vital source for lead acquisition. Complete traceability of customer journeys depends on robust digital commerce capabilities, emphasizing their broader significance.

While understanding the scope of eCommerce is straightforward, selecting and implementing the right eCommerce platform for your digital objectives poses challenges. Issues like integrating payment and shipping providers, ensuring optimal site speed, and minimizing bounce rates are crucial for capturing a significant share of web traffic. As the number of channels continues to expand, evaluating pre-built integration capabilities becomes essential to prevent cost overruns. With increasing transaction volumes, the necessity for enterprise-grade features like digital asset management, approval flows, and a comprehensive digital experience management platform becomes evident. Additionally, operating in a regulated environment adds complexity, introducing compliance requirements that impact your transactions.


The 2025 Digital Transformation Report

Thinking of embarking on a ERP journey and looking for a digital transformation report? Want to learn the best practices of digital transformation? Then, you have come to the right place.

Ultimately, even if a platform functions effectively with lower transaction volumes, the inability to scale with concurrent sessions—characteristic of enterprise-grade systems—can lead to missed opportunities. These factors contribute to the complexity of choosing eCommerce platforms. To navigate this challenge, consider initiating your journey by shortlisting a couple of options from the leading eCommerce platforms in 2024.

Criteria

  • Overall market share/# of customers. The higher the market share of the eCommerce platform, the higher it ranks on our list.
  • Ownership/funding. The more committed the management to the product roadmap of the eCommerce capabilities, the higher it ranks on our list.
  • Quality of development (legacy vs. legacy dressed as modern vs. modern UX/cloud-native). The more modern the development stack, such as headless and React-based development, the higher it ranks on our list.
  • Community/Ecosystem. The larger the community with a heavy presence from eCommerce companies, the higher it ranks on our list.
  • Depth of native functionality for specific industries. The deeper the publisher-owned out-of-the-box functionality, the higher it ranks on our list.
  • Quality of publicly available product documentation. The poorer the product documentation, the lower it ranks on our list. 
  • eCommerce market share and documented commitment (of the publisher through financial statements). The higher the focus on eCommerce, the higher it ranks on our list.
  • Ability to natively support diversified business models. The more diverse the product to support different business models and business processes, the higher it ranks on our list.
  • Acquisition strategy aligned with eCommerce. The more aligned the acquisitions to deepen eCommerce capabilities, the higher it ranks on our list.
  • User Reviews. The deeper the reviews from eCommerce users, the higher the score for a specific product.
  • Must be an eCommerce platform. It can’t be a module of an ERP or CRM product. It can’t be an app that might support eCommerce and POS processes. At a minimum, the product must support CMS and website development for different business models.

10. WooCommerce

WooCommerce primarily caters to small, content-focused companies aiming to augment their static websites with commerce capabilities, which are particularly appealing to entrepreneurs familiar with WordPress. However, businesses surpassing the $5-10 million revenue mark might encounter limitations in WooCommerce, making it more suitable for content-driven companies with lighter eCommerce requirements.

Despite its widespread popularity and numerous installations, WooCommerce’s commerce capabilities face substantial limitations, leading to conflicts among plugins. The security architecture isn’t tailored for commerce transactions, potentially causing failed eCommerce projects. While debates about transaction and commercial fees persist, ongoing maintenance and development efforts are comparable to both open-source and commercial platforms. Due to these considerations, we’ve significantly downgraded WooCommerce in this year’s ranking, replacing the Microsoft Commerce platform, which no longer features on the list due to limited developments in its ecosystem.

Strengths
  1. Price. WooCommerce offers budget-friendly pricing for startups, supported by a robust ecosystem of plugins and developers.
  2. Open-source. As an open-source platform, WooCommerce benefits from a vibrant developer community, eliminating licensing fees.
  3. Superior Content Management System. Leveraging WordPress, WooCommerce provides an excellent content management system with extensive plugin options.
Weaknesses
  1. Clunky User and Permission Management. Dependency on WordPress for user and role management poses challenges in handling complex B2B and B2C workflows. The workflows, especially those that involve multiple user personas.
  2. Plugin Conflicts. Multiple plugins are required for eCommerce operations, leading to potential conflicts that demand careful analysis and management.
  3. Data Model. Suited for content-centric operations, WooCommerce’s weaker data model may result in data integrity and maintenance issues compared to other platforms on the list.

9. Kibo Commerce

Kibo Commerce, an omnichannel and microservices-based eCommerce platform, empowers businesses to launch enterprise-scale commerce experiences that would traditionally require custom development. Its API-first and microservices-based design aligns with modern headless commerce platforms, enabling businesses to meet customer demands with agility.

The platform adopts an integrated approach, encompassing Order Management System (OMS), eCommerce, and subscription commerce. However, it faces competition from larger peers like Manhattan and IBM Sterling Commerce, which offer more integrated options within the same stack, including Warehouse Management System (WMS) and Transportation Management System (TMS).

While Kibo’s OMS effectively maintains a centralized statistical inventory, financial perspectives are often disconnected from the operational layer. In eCommerce and retail models, decoupling transactions for subsequent financial reconciliation is a common practice due to higher transaction volumes. Although Kibo excels in front-end experiences, it may encounter challenges with backend integration and supply chain issues, earning it the #9 spot among the top digital commerce platforms in 2024.

Strengths
  1. Enterprise Scalability. The microservices architecture facilitates individual scaling of commerce layers, ensuring enterprise scalability for peak shopping scenarios.
  2. Integrated OMS and eCommerce. Kibo offers pre-baked integration of eCommerce and OMS, saving considerable costs compared to building from scratch.
  3. Subscription Commerce. The platform includes built-in subscription workflows, a challenging feature to develop on vanilla platforms.
Weaknesses
  1. Limited Commerce Solution. Unlike competitors like Manhattan and Blue Yonder, which integrate a Warehouse Management System (WMS) and Transportation Management System (TMS), Kibo’s offering may not be as embedded.
  2. Limited Ecosystem and Consulting Base. Kibo’s consulting base is limited, affecting documentation and community support for their product.
  3. Cost. Positioned as a best-of-breed integrated commerce and OMS platform, Kibo tends to be more expensive than mid-market alternatives like BigCommerce or Shopify.

8. SAP Hybris Commerce

SAP Hybris Commerce targets larger enterprises with robust requirements, especially those already integrated into other SAP systems. This strategic alignment enables businesses to capitalize on integration synergies by exclusively partnering with a single vendor.

The eCommerce platforms landscape witnessed significant transformations in 2023, driven by the anticipated discontinuation of Oracle Commerce. This development sparked concerns about the potential sunset of legacy platforms like SAP Hybris, HCL Commerce, and Intershop. 

Despite these challenges, SAP Hybris has made noteworthy advancements in its headless technology stack, contributing to its improved ranking this year. While it may no longer be a frontrunner, SAP Hybris remains a viable choice for companies seeking an embedded and regulated experience, particularly with its CPQ and configurator layer. For these reasons, SAP Hybris Commerce secures the #8 position on our list.

Strengths
  1. Integration with Other SAP Products. SAP Hybris Commerce is particularly advantageous for enterprise companies in regulated industries, ensuring audit readiness for compliance standards like GDPR.
  2. Greater Control Over Infrastructure. The deployment suite of SAP Hybris Commerce offers comprehensive CI/CD capabilities, empowering IT teams to manage release and production support processes effectively.
  3. Deployment Flexibility. SAP Hybris allows deployment on the preferred cloud, providing greater control over infrastructure design and costs—a valuable feature for larger companies with high eCommerce site traffic.
Weaknesses
  1. Lagging in Headless Capabilities. SAP Hybris doesn’t boast strong out-of-the-box headless capabilities compared to other platforms on the list, coupled with a limited ecosystem of partners.
  2. Clunky Interface. The Hybris CMS exhibits a clunky interface resembling a customer portal rather than a modern eCommerce platform.
  3. Reliance on Legacy Technology. SAP Hybris still relies on legacy programming languages like Spring and Java, lacking robust support for out-of-the-box enterprise-grade features such as an asset management platform.

7. HCL Commerce

HCL Commerce, the enhanced iteration of IBM’s flagship product, IBM Commerce, inherits and advances its capabilities for modern headless development after acquiring it from IBM. Notably, it excels in offering enterprise-grade commerce features, allowing access to all of the commerce layers, including DAM assets, search, and cart, through APIs. 

While HCL Commerce introduces headless, React-based composable commerce capabilities, it primarily targets B2C brands. As a new entrant on our list, it replaces other eCommerce platforms like Oracle Commerce.

Strengths
  1. Headless Content Workflow and Management. HCL Commerce facilitates the retrieval and programmable publishing of DAM assets, leveraging enterprise versioning capabilities inherited from IBM Commerce. This supports intricate workflows for content collaboration.
  2. React-based Storefront Capabilities. With modern React-based composable commerce features, HCL Commerce enables the construction of omnichannel storefronts tailored for various geographical locations.
  3. Enterprise Scale Ready. Having proven its mettle with enterprise-grade commerce workloads over decades, HCL Commerce is an ideal choice for teams familiar with IBM Commerce, eliminating the need to learn a new data model and platform from scratch.
Weaknesses
  1. Legacy Programming Language and Architecture. Despite a redesigned front end, the back end still relies on legacy Java and Spring boilerplate, coupled with IBM’s intricate development practices, which might be less user-friendly for web developers.
  2. Limited B2B Capabilities. HCL Commerce’s data model isn’t optimized for industrial B2B use cases, making it more suitable for high-volume B2C companies. B2B companies might need significant investments in custom development.
  3. Limited CDP Capabilities. For B2C companies seeking personalization capabilities based on deterministic identity, HCL Commerce falls short compared to platforms like SAP Hybris, Sitecore, and Salesforce Commerce.

6. Episerver Digital Commerce

Episerver Digital Commerce/Optimizely is tailored for mid-to-large B2B companies seeking comprehensive B2B capabilities within a suite, minimizing the need for costly add-ons and extensive IT resources. Particularly advantageous for industrial businesses, it falls short of a fit for larger organizations requiring the robust enterprise-grade capabilities offered by bigger eCommerce platforms. 

Unlike some SMB platforms dependent on add-ons for digital experimentation, Episerver integrates the ability to build features and A/B tests seamlessly into its suite. It excels in providing deep features for intricate channels, encompassing partner management, product-based variants, and rule-based promotions.

Strengths
  1. Content Management Platform. Episerver’s CMS stands out for its flexibility, allowing marketers to execute intricate layout changes swiftly, enhancing the overall content management experience.
  2. Digital Experimentation Platform. In contrast to SMB platforms relying on additional components for digital experimentation, Episerver enables the creation of features and A/B tests seamlessly within its suite, ensuring full traceability across channels.
  3. Natively Supported Rich B2B Features. Episerver impresses with its provision of deep features catering to complex channels, including partner management, product-based variants, and rule-based promotions.
Weaknesses
  1. Ecosystem. Unlike the thriving communities surrounding platforms like Shopify or BigCommerce, Episerver faces limitations in terms of its ecosystem.
  2. Too Big for Smaller Brands. Geared toward larger companies, Episerver may overwhelm smaller brands due to its steeper learning curve.
  3. Expensive. Smaller brands with simpler needs might find Episerver’s pricing to be on the higher side.

5. Commercetools / Frontastic

commercetools, a startup valued at over $2 billion and backed by Accel, has garnered attention from major automotive brands like Audi, Volkswagen, Porsche, and Bentley for its customizable commerce experience. Pioneering a true microservices-based architecture, commercetools is a key advocate of the MACH alliance. 

Although the MACH and headless concept is relatively nascent, businesses prioritizing customized and composable experiences will find commercetools compelling. However, commercetools doesn’t offer the same bundled enterprise solutions as some competitors, potentially requiring several best-of-breed options for a comparable experience.

Strengths
  1. True MACH Platform. commercetools embodies the MACH principles—Microservices, API-first, Composable, and Headless—differentiating itself from platforms with mere APIs claiming to be headless.
  2. B2C-Friendly. Tailored for B2C companies, particularly in industries like automotive, commercetools boasts a data model conducive to interactive commerce experiences, with enterprise-grade B2C features embedded in its platform.
  3. Enterprise Scale. Proven in handling complex, multi-brand sites with billions of hits, commercetools has successfully secured clients that traditionally leaned towards legacy platforms like Oracle ATG, Hybris, or IBM Commerce.
Weaknesses
  1. Limited Head Capabilities. While commercetools provides robust APIs for the quick development of omnichannel heads, marketing practitioners may find its head limitations notable, even with the acquisition of Frontastic.
  2. Limited Bundle Offerings. While ideal for best-of-breed platform users, commercetools might be less appealing to organizations seeking bundled offerings available in tools like Sitecore or Salesforce Commerce, especially those favoring seamless integrations.
  3. Limited B2B Capabilities. Although commercetools is expanding B2B features, the distinct data model requirements for B2B may limit its applicability for industrial distributors and B2B companies.

4. Salesforce Commerce

Salesforce strategically targets larger enterprise companies seeking sophisticated eCommerce workflows, particularly those already leveraging other Salesforce products like CRM and Pardot. While it excels in catering to enterprise scenarios with a vibrant developer ecosystem and involvement in the React and headless communities, it may not be the optimal choice for smaller businesses. Salesforce Commerce stands out for supporting both B2B and B2C models, providing deep capabilities and robust product recommendations through its AI engine.

Maintaining its position from the previous year, Salesforce Commerce’s commitment to the eCommerce market is evident, backed by ongoing investments in eCommerce-centric capabilities through Salesforce ventures. Notably, it remains the sole platform on this list with equally profound capabilities for both B2B and B2C. However, its pricing structure may be considered expensive for SMB companies.

Strengths
  1. Ecosystem. Salesforce boasts one of the most vibrant developer ecosystems, actively participating in the React and headless communities. Additionally, it offers integration with modern headless platforms, facilitating the development of progressive web applications.
  2. Enterprise-grade Capabilities. Catering to both B2B and B2C models, Salesforce Commerce provides deep capabilities for enterprise scenarios, complemented by seamless integration with other Salesforce products.
  3. Robust Merchandising and Product Recommendation Capabilities. Distinguishing itself from other SMB products, Salesforce Commerce delivers robust product recommendation and merchandising planning capabilities through its AI engine.
Weaknesses
  1. Price. The pricing structure of Salesforce may be perceived as expensive by most SMB companies. Unlike competing products that include these capabilities in their suite, Salesforce Commerce employs separate pricing for its products, making total cost of ownership computation more challenging.
  2. Headless. While options for a headless experience are available on the Salesforce app marketplace, the platform lags behind in its headless journey compared to competitors like commercetools or VTEX.
  3. Challenging for Smaller Brands. The steep learning curve associated with Salesforce Commerce may overwhelm smaller companies that are less focused on enterprise-grade features.

3. Adobe Commerce/Magento

Adobe Commerce caters to mid-large enterprise companies with intricate eCommerce workflows, particularly those with complex needs for both B2B and B2C business models. However, it may not be the most suitable option for smaller companies. While Adobe Commerce/Magento offers an open-source version, many companies may opt for the enterprise edition for features like RMA and promotion permission, which are not available in the community edition. Noteworthy is Magento’s capability to run large-scale consumer-focused commerce sites with millions of daily visitors, though this scale typically requires the enterprise edition.

Maintaining its position from the previous year, Adobe Commerce is recognized for its commitment, backed by Adobe, and continues to attract an expanding customer base.

Strengths
  1. Enterprise-grade Functionality for B2B and B2C. Adobe Commerce/Magento boasts an exceptionally rich data model tailored for enterprise workflows, providing robust support for both B2B and B2C business models.
  2. Open-source. While an open-source offering is available, many companies opt for the enterprise edition to access features like RMA and promotion permission, which are unavailable in the community edition.
  3. Scale. Distinguishing itself from other platforms, Magento successfully powers large-scale consumer-focused commerce sites with millions of daily visitors, necessitating the enterprise edition.
Weaknesses
  1. Inflexibility. Magento’s data model exhibits tight data integrity with a prescriptive approach to eCommerce, aiming to prevent maintenance issues in the long run. However, this level of inflexibility may not be appreciated by developers.
  2. Overwhelming for Business Users. Business users may find the platform less user-friendly compared to some alternatives due to the complexity of Magento’s data model.
  3. Challenging for Smaller Brands. Adobe Commerce/Magento may prove overwhelming for smaller brands that are less focused on advanced eCommerce features and are in need of developer support.

2. BigCommerce

BigCommerce focuses on meeting the deep functionality needs of B2B SMB organizations, particularly those lacking internal IT capabilities for designing and supporting eCommerce operations. However, it may not be the ideal choice for larger companies. With an underlying data model tailored for B2B organizations, BigCommerce can accommodate complex product mixes and variants, which is especially critical for B2B organizations, with some B2C organizations requiring similar features as well.

Despite its popularity among smaller merchants, the growing BigCommerce ecosystem and capabilities might prove limiting, necessitating the use of multiple add-ons. While the platform offers pre-baked integrations with POS and ERP systems, building an omnichannel architecture could pose challenges due to the number of required add-ons. Additionally, BigCommerce has limited headless capabilities. Nevertheless, it maintains its previous ranking due to its momentum.

Strengths
  1. Deep Capabilities for B2B. BigCommerce’s underlying data model is designed to support the complex needs of B2B organizations dealing with intricate product mixes and variants.
  2. User-Friendly. While catering to the needs of B2B organizations, the platform is not as overwhelming as some enterprise-grade alternatives, requiring less training for business users.
  3. Flexible Pricing Options. BigCommerce provides companies with various pricing options at different stages of their journey.
Weaknesses
  1. Limited Enterprise-grade Features. The core suite may lack certain enterprise-grade features such as product recommendations, digital asset management, and digital experimentation management, requiring additional add-ons and incurring extra costs.
  2. Not Tailored for B2C Experiences. The distinct B2B data model might overwhelm companies primarily focused on B2C experiences, making it less suitable for such scenarios.
  3. Pricing Structure. Companies disliking GMV-based pricing may find BigCommerce’s pricing model less appealing, especially if they have internal IT capabilities for support.

1. Shopify

Shopify caters to B2C SMB organizations with products that don’t require intricate configurations, making it ideal for brands seeking omnichannel and DTC experiences without heavy IT infrastructure investments or developer assistance. Its ecosystem is a significant advantage, offering diverse options, and the Hydrogen on Oxygen headless platform has gained favor among the development community.

However, Shopify’s drawback lies in transaction fees and the need for add-ons to access complex B2C and B2B features. Despite these considerations, its thriving ecosystem ensures it maintains the top rank.

Strengths
  1. Simplicity for B2C. Shopify’s user-friendly data model suits B2C companies, providing flexibility and simplicity accommodating various payment providers and shipping options.
  2. Omni-channel Commerce. With pre-integrated POS, Shopify facilitates seamless data and inventory sharing across digital and physical channels, enabling a hassle-free omnichannel experience without costly custom integrations.
  3. Vibrant Ecosystem. Shopify boasts one of the most active developer ecosystems, heavily engaged in modern tech stacks and Javascript-based communities.
Weaknesses
  1. B2B Limitations. Although Shopify recently introduced B2B capabilities, they may be limited and more suitable for companies supporting both business models. Industrial distribution companies might find these capabilities restrictive.
  2. Transaction Fees. Companies uncomfortable with GMV-based pricing might perceive Shopify’s fee structure as unfavorable.
  3. Enterprise-grade Features. Unlike competitors offering bundled enterprise features, Shopify requires add-ons or third-party products for digital asset and experience management.

Conclusion

Selecting an eCommerce platform poses challenges. A profound grasp of financials is essential for comprehending total ownership costs, coupled with the expertise of independent eCommerce consultants to estimate custom functionality efforts. Additionally, this decision impacts overall architecture and operational efficiency, necessitating a comprehensive approach to eCommerce platform selection.

FAQs

Top 10 CRM Systems in 2024

Top 10 CRM Systems in 2024

In the past, sales and marketing operations could suffice with ad-hoc tools like spreadsheets or siloed software. However, the complexity of today’s sales and marketing departments demands more. CRM workflows differ significantly across industries and business models. For a natural and seamless experience, your CRM needs to support the specific data model required for your industry. The power of CRM lies in its ability to gather high-quality data from various systems and make it easily accessible to salespeople. However, obtaining this data can be challenging, especially if the CRM’s data model significantly deviates from your customer hierarchies and transactions.

Furthermore, the boundaries between CRM, CMS, call center systems, e-commerce, and ERP are becoming increasingly blurred. Modern CRMs now incorporate functionalities that traditionally belonged to ERP or e-commerce systems. The CRMs also overlap substantially with CMS systems, which have traditionally been home-grown due to the custom development required to build unique customer-centric workflows, especially the industries that want to track and manage their digital interactions.

Top 10 CRM Systems In 2024

This intersection necessitates a clear definition of the roles and responsibilities of various systems involved in managing customer-centric workflows. Without a well-structured architecture, challenges in adoption and data integrity may arise. Although some CRM systems may showcase adaptability across industries, it’s crucial to acknowledge that the leading CRM systems, despite their market dominance, may not universally cater to every industry or business model. Consequently, selecting a CRM demands a thorough examination of your architecture and a comprehensive understanding of available solutions. To kickstart this process, consider exploring a list of the top CRM systems in 2024.


The 2024 Digital Transformation Report

Thinking of embarking on a ERP journey and looking for a digital transformation report? Want to learn the best practices of digital transformation? Then, you have come to the right place.

Criteria

  1. Overall market share/# of customers. The higher the market share in the CRM market, the higher it ranks on our list.
  2. Ownership/funding. The more commitment to the CRM offerings, the higher it ranks on our list.
  3. Quality of development (legacy vs. legacy dressed as modern vs. modern UX/cloud-native). The more cloud-native capabilities, the higher it ranks on our list.
  4. Community/Ecosystem. The larger the community with a heavy presence from CRM users, the higher it ranks on our list.
  5. Depth of native functionality for specific industries. The deeper the publisher-owned out-of-the-box functionality, the higher it ranks on our list.
  6. Quality of publicly available product documentation. The poorer the product documentation, the lower it ranks on our list. 
  7. Ability to natively support diversified business models. The more diverse the product, the higher it ranks on our list.
  8. Acquisition strategy aligned with CRM offerings. The more aligned the acquisitions are with CRM offerings, the higher they rank on our list.
  9. User Reviews. The deeper the reviews for CRM offerings, the higher the score for a specific product.
  10. Must be a CRM product. It can’t be a CRM integrated with an ERP (that enterprise software vendors can’t sell standalone). Must contain deep sales and marketing operations capabilities. For example, marketing automation, territory planning, and sales and marketing workflow management.

10. Oracle CX Cloud

Oracle CX Cloud incorporates various best-of-breed CRM components, including sales, marketing, service, content management, and advertising cloud. It is tailored for large B2C enterprises, specifically those in industries like communications, media, and financial services. With Oracle Commerce being discontinued, the scope of Oracle CX Cloud may be confined to fewer industries. 

The recent acquisition of Cerner, which serves as a customer-facing channel for the healthcare market, raises questions about Oracle’s continued investment in the CRM portfolio. Furthermore, Oracle has consistently pursued industries with substantial data and analytical workloads. Given the current economic landscape, healthcare emerges as a more lucrative market compared to commerce and customer experience. Consequently, Oracle CX may not receive equivalent attention within the company’s portfolio. Despite this, it maintains the #10 ranking on our list as an enterprise-grade solution for businesses seeking an integrated CRM experience.

Strengths: 
  1. Marketing Automation and Ad Spend Tracking: Providing in-depth insights into customer behavior across various advertising platforms.
  2. Content and Centralized Asset Management: These features are particularly crucial for content-intensive industries such as media and telecom.
  3. Integration with Enterprise-grade CPQ and Sales Performance Management Tool: Offering a configurator for subscription-based offerings. This integration is especially beneficial for verticals like media and telecom. 
Weaknesses:
  1. Clunky UI: Oracle has incorporated various systems into its CX portfolio to enhance its capabilities, making a seamless experience challenging.
  2. Not as Strong B2B and Post-sales Capabilities: Oracle’s CRM falls short in post-sales CRM processes, particularly in B2B industries where pre-sales processes, such as manufacturing or distribution, are less extensive.
  3. Not as Strong for Regulated and Audit-centric Industries: Additionally, Oracle CRM may face challenges in industries and regions with significant audit requirements, such as GDPR compliance and version control.
+

ECommerce Supply Chain Transformation

Learn how LockNLube transformed its inventory and supply chain challenges by consolidating over 20 systems.

9. SAP C/4 HANA

SAP C/4 HANA, an integral part of the S/4 suite, offers a range of best-of-breed CRM options in the CX portfolio, including sales, marketing, commerce, customer experience, and service cloud. It caters primarily to large utility, finance, and public sector companies, especially those with deep regulatory workflow requirements within CRM processes. 

The recent spin-off of Qualtrics may suggest that SAP is not as committed to the CX portfolio. Moreover, SAP faces substantial challenges with newer entrants in the headless space to disrupt its commerce portfolio. Still a viable option for companies requiring tight integration with CPQ and configurator available through the Hybris portfolio, SAP C/4 HANA still maintains the same ranking as last year.

Strengths:
  1. Integration with Gigya and Customer Data Cloud. Noteworthy strengths include consent and preferences with audit-ready capabilities for compliance workflows such as GDPR, CCPA, and LGPD. It also offers cross-channel personalization and identity management.
  2. Integration with Other SAP S/4 HANA Products. Embedded experience because of the tight integration among SAP products is one of the biggest highlights of SAP C/4 HANA.
  3. Integration with Enterprise-grade CPQ and Sales Performance Management Tool. Companies with enterprise-grade quoting, sales territory, and compensation management needs will find C/4 HANA appealing.
Weaknesses:
  1. Marketing Automation. C/4 HANA lacks sophistication in pre-sales processes, including marketing automation.
  2. Tight Integration with SAP Products. The data model may feel restrictive for sales and marketing teams seeking fluidity to focus on sales rather than operational details.
  3. Inflexibility and Complexity of the Solution. Enterprise workflows like approval management, regulatory checks, and budgetary approvals may seem unnatural and complex for small to mid-size organizations seeking more straightforward CRM solutions.

8. Zendesk Sell

Zendesk Sell, an entry-level CRM among top CRM systems designed for companies utilizing ZenDesk for customer service and ticketing workflows, acquired these capabilities through the Base CRM acquisition. It targets smaller companies with under 10-15 employees, lacking mature CRM capabilities such as sales ops planning, marketing automation, and territory management. However, larger companies may find its capabilities limiting. 

Also, most enterprises exploring CRMs require custom development capabilities because of the unique customer experience and service workflows. So Zendesk would not be a fit for them seeking customizability as offered by other platforms such as Salesforce or HubSpot on this list. Zendesk maintains its ranking from the previous year, with no significant developments observed.

Strengths:
  1. Simple Interface for Startups. Zendesk’s interface is appealing to users with straightforward CRM needs, especially for lead and opportunity tracking, resembling the look and feel of HubSpot and Close.io.
  2. Easier Transition for Zendesk Users. Users of Zendesk will find it attractive due to the similar interface and the ability to create integration workflows between the two apps.
  3. Easier Calling and Emailing Natively within the App. Zendesk’s design is user-friendly for sales development reps involved in multi-touch campaign execution and tracking directly within the app.
Weaknesses:
  1. Zendesk Sell and Support are not tightly integrated. Despite being part of the Zendesk suite, Sell and Support apps lack tight integration, resulting in a disjointed experience and minimal data exchange between them.
  2. Marketing Automation. Marketing automation capabilities in Zendesk CRM are not as robust, necessitating the use of third-party marketing automation software and an additional license.
  3. Advanced CRM Capabilities. Zendesk CRM offers limited advanced features such as reporting, CSV import/export, and revenue operations planning.
+

Omnichannel ECommerce Customer Experience Transformation

Learn how fashion retailer AKIRA built a digital roadmap and managed stakeholder expectations to transform its processes and systems.

7. Monday.Com

Monday.com is geared towards small companies already using it for project management and those with custom CRM workflow needs, such as real estate and non-profits. However, it may not be an ideal choice for companies that can easily find other options through a pre-built platform.

Implementing Monday.com internally would require a tighter governance process, especially if it is being used for cross-functional workflows. The fluidity of the platform might lead to business users’ overengineering process, leading to the creation of technical backlog and maintenance nightmares in the long term. Also, confidently predicting and estimating the final costs requires solution architecture expertise. The ranking for Monday.com remains unchanged from the previous year, with no significant developments observed.

Strengths:
  • Better Customizability. Monday.com serves as a highly customizable technical platform, excelling in ad-hoc workflows and offering superior customization capabilities.
  • Easily Build Automated Actions and Integration with Other Apps. Business users find it easy to construct automated actions for notifications and approval flows.
  • Best for Industries Such as Real Estate and Non-profits. Industries like real estate and non-profits requiring flexibility for customized processes may find Monday.com suitable for their unique needs.
Weaknesses:
  1. Risk of Over-Engineering Processes. While its customizability is beneficial for specific industries, there’s a risk of over-engineering processes, potentially impacting downstream workflows.
  2. Primarily a Project Management Tool. Monday.com is fundamentally a project management tool, necessitating the construction of advanced CRM functionality and reports.
  3. Data Integrity. Due to its technical nature, Monday.com may lack referential integrity between business objects, potentially leading to data integrity issues.

6. SugarCRM

SugarCRM caters to smaller companies seeking free or open-source software and those with specific CRM workflows. However, it may not be the best fit for larger companies in search of a robust CRM solution. SugarCRM maintains its ranking among top CRM systems, with no significant developments observed.

Strengths:
  1. On-prem Option with the Community Edition. SugarCRM provides a community edition that can be hosted on-premises, making it favorable for companies with existing server infrastructure.
  2. Ability to Build Ads Right from the Platform. SugarCRM stands out with features like the ability to build ads directly from the platform, streamlining the interface for companies managing ads without juggling multiple tools.
  3. Great for Cost-sensitive Organizations. Cost-sensitive organizations with in-house developers benefit from SugarCRM, eliminating concerns about recurring licensing fees.
Weaknesses:
  1. Clunky Interface. The interface lacks modernity, potentially hindering user adoption, particularly within sales teams.
  2. Limited Reporting Capabilities. SugarCRM’s reporting capabilities are restricted, requiring significant investment in development and internal costs to generate reports.
  3. Potential Higher Costs with the Community Edition. While the community edition doesn’t have a licensing fee, organizations are responsible for support, upgrades, patches, hosting, and security. Despite its cost-saving intent, it may end up being as expensive as SaaS options.

5. Pipedrive CRM

Pipedrive CRM is designed for smaller companies and solo founders with limited budgets seeking an entry-level CRM solution for customer interaction management. However, it may not be the best fit for larger companies with mature CRM processes requiring features like territory planning, quoting, and sales compensation management. Pipedrive CRM maintains its previous ranking among top CRM systems, with no significant developments noted.

Strengths:
  1. Workflow Automation: Pipedrive CRM offers workflow automation capabilities that are beneficial for companies looking to minimize data entry and automate lead capture and nurturing processes.
  2. Similar Look-and-feel as HubSpot: With a data model and user interface similar to HubSpot, Pipedrive CRM provides a familiar experience that aids sales teams, especially those less technically inclined.
  3. Easy Customization of Reports and Goal Setting: Teams with limited technical proficiency will find Pipedrive’s reports easy to customize compared to more complex tools.
Weaknesses:
  1. Weak Data Structure for Complex B2B Organizations: B2B organizations with intricate customer hierarchies may struggle to integrate with Pipedrive due to its weak data structure. Limitations in data model sharing for leads and contacts can pose challenges for larger companies.
  2. Limited Data Import and Export Functionality: Companies seeking robust data import and export capabilities, especially for leads and opportunities from external systems, may find Pipedrive limiting.
  3. Not Suitable for Larger Organizations: Pipedrive CRM may not meet the needs of larger organizations with deeper requirements for territory management, sales compensation, and approval workflows.

4. Zoho CRM

Zoho CRM is tailored for smaller professional services companies like marketing agencies, tech startups, and software development firms. It proves especially effective for those already utilizing Zoho for HCM or accounting purposes. However, it may not meet the advanced CRM needs of product-centric organizations. Zoho CRM maintains its previous ranking with no significant developments noted.

Strengths:
  1. Data Model Similar to Salesforce: Zoho’s data model mirrors Salesforce’s, facilitating implementation and integration with systems like ERP that have complex customer masters.
  2. Workflow for Data Quality: Zoho CRM includes a pre-packaged workflow builder, allowing teams with development expertise to construct intricate workflows. This aids in maintaining data hygiene and enhancing CRM adoption.
  3. Zoho Creator: The inclusion of Zoho Creator, an app development platform in the suite, enables developers to swiftly integrate other software and create custom apps without relying on additional third-party tools.
Weaknesses:
  1. Advanced CRM Features: Zoho CRM may not be suitable for large companies with regulatory, compliance, or planning needs due to its weaker out-of-the-box support for these capabilities.
  2. Territory Management and Sales Team Planning: Zoho CRM lacks robust support for territory management and sales team planning compared to some of the other leading CRM solutions.
  3. Limited Integration Options Outside of Zoho: While excelling within the Zoho ecosystem, integration options outside Zoho are limited. Connecting with other systems would require custom integration and development efforts.

3. HubSpot CRM

HubSpot CRM is a leading choice for smaller companies aiming for seamless integration of customer-centric workflows, covering essential CRM processes such as sales, service, CMS, and marketing automation. In contrast to Salesforce, HubSpot excels in user-friendliness and customization, even though it may not match the depth of customer and field service workflows or provide as many built-in custom objects for specific industries. 

However, this adaptability might pose challenges for companies unfamiliar with robust data and process governance. HubSpot CRM proves advantageous, especially for content-heavy B2B companies aiming for centralized management of digital marketing and sales channels. The recent acquisition of Clearbit further enhances HubSpot’s capabilities by integrating data and intelligence with core CRM processes, solidifying its position as the third-best CRM solution on our list.

Strengths:
  1. Price: HubSpot CRM stands out for companies seeking a more affordable CRM option than Salesforce.
  2. Marketing Automation and Omnichannel Tracking: One of the strongest marketing automation tools integrating all channels, including emails, social media, and the web.
  3. Ecosystem: HubSpot boasts a strong ecosystem and seamless integration with other CRM systems, CMS platforms, and eCommerce tools for users focusing on marketing automation.
Weaknesses:
  1. Weaker Data Model for B2B Businesses: The companies requiring ERP-like operational capabilities, including CPQ inside HubSpot, might struggle with the leaner object model of HubSpot.
  2. Advanced CRM Features: HubSpot may not suit companies with deeper compliance, regulatory, and quoting needs, necessitating substantial development on top of the platform.
  3. Territory Management and Sales Team Planning: The weaker data model makes it less suitable for industries requiring robust out-of-the-box capabilities for territory management and sales team planning, where referential data integrity is crucial for accurate CRM data.

2. Microsoft Dynamics CRM

Microsoft Dynamics 365 CRM is designed for mid-to-large-sized companies, especially those leveraging other Microsoft products such as Dynamics 365 ERP. However, for smaller companies seeking data model fluidity, it may not be the ideal choice.

Microsoft secures the second-largest market share in the CRM space, following Salesforce. It particularly appeals to companies prioritizing robust operational capabilities within the CRM, including features like territory planning, global and centralized compliance, complex CPQ processes, and tight integration with project management workflows.

While Microsoft excels in supporting operational processes, its integration support may be limited to commerce and content management platforms, modern search technologies, headless platforms, data and intelligence providers, and centralized social media management platforms. Despite these considerations, Microsoft Dynamics CRM remains a formidable player in the CRM market, securing its position at #2 in our list of top CRM options.

Strengths:
  1. Complex Business Object Support: Facilitates the creation of necessary permissions and approval flows crucial for larger, regulated enterprises.
  2. Integrated Microsoft Ecosystem: With database-level replication and a shared common data model, integration with other Microsoft products is seamless.
  3. Advanced Territory Management: The CRM comes pre-packaged with strong capabilities for advanced territory management and global sales compensation planning.
Weaknesses:
  1. Less Fluid Data Model: Dynamics 365 CRM has tighter dependencies between objects, particularly regarding pricing, products, and their correlations with accounts, posing usability challenges compared to more flexible CRM systems.
  2. CSV Import and Export Challenges: The platform lacks intuitive support for CSV import and export, making it less user-friendly for sales teams looking to import opportunities and leads from external systems.
  3. Limited Marketing Automation: The marketing automation component in Dynamics 365 lacks strong ecosystem support with external CMS providers.

1. Salesforce CRM

Salesforce serves companies of all sizes, featuring a startup-friendly version and excelling in managing complex CRM workflows. While not always the ideal choice for entities with unique CRM processes, such as those in real estate or uniquely structured non-profit organizations, Salesforce comprehensively covers enterprise sales and marketing workflows throughout all phases—pre-sales, sales, and post-sales. The platform stands out for its depth in industry-specific sales and marketing processes, offering pre-populated layers of business objects without the need for custom development on vanilla platforms. 

The Salesforce ecosystem holds authority in headless and commerce spaces, positioning it as an ideal enterprise Cx platform for various industries. These strengths contribute to Salesforce CRM maintaining its #1 position on our list.

Strengths:
  1. Robust Data Model for Varied CRM Needs: Salesforce boasts the most extensive data model, catering to the complex requirements of diverse industries and business models.
  2. Specialized Capabilities in Telecom and Media: Salesforce stands out with advanced product and CPQ capabilities, particularly beneficial for industries like medical devices and telecom.
  3. Comprehensive Product Portfolio and Ecosystem: Offering best-of-breed solutions across all CRM areas, including marketing automation, field services, and eCommerce.
Weaknesses:
  1. Cost: Salesforce may have a higher price tag compared to other CRMs, making the per-seat cost more expensive.
  2. Complex Customization Process: Customization in Salesforce may not be as intuitive as in other CRM systems, with a potentially complex and dated object model due to the mix of lightning and legacy interfaces.
  3. Industry-Specific Limitations: While Salesforce excels in certain industries, it may not be the best fit for every sector, requiring deep collaboration with ERP systems.

Conclusion

As customer experience takes center stage in securing business deals, sales and marketing departments increasingly require advanced CRM capabilities. A comprehensive CRM is essential for maintaining a centralized view of customers throughout their journey, whether in the pre-sales or post-sales phase. Without a CRM offering a centralized workflow and interaction management platform, competing in today’s market conditions can pose significant challenges.

The choice of CRM directly influences your enterprise architecture. Therefore, selecting a CRM that aligns with your business model and enterprise architecture is paramount for the success of digital transformation initiatives. If you’re currently evaluating CRM systems, consider the points highlighted above in addition to the expertise of independent CRM consultants. This list aims to assist you in narrowing down suitable options for your needs. 

FAQs

Top 10 Systems for Your Enterprise Architecture

Top 10 Systems for Your Enterprise Architecture

Enterprise architecture is more than a technical concept. But what is enterprise architecture? Think of enterprise architecture as the connected business systems that drive your operational processes with four primary perspectives. 1) business architecture, 2) process architecture, 3) data/information architecture, and 4) system architecture. Generally, most industries have two choices when building their architecture. They can either buy a system or build it themselves. But regardless of whether you buy or build, your enterprise architecture is equally important.

Top 10 Systems For Your Enterprise Architecture - List

Also, some people might feel that ERP might be the answer to all of their system issues. They might also feel that enterprise architecture is only relevant for larger companies. However, even ERP systems require a well-defined architecture around them. So, regardless of the organization’s size, the lack of architecture results in ERP implementation failure. As well as poor adoption of digital initiatives and unforeseeable business disruptions. Understanding the enterprise architecture and each system’s role is crucial for your digital journey. In this article, we have covered major systems that your architecture might need as you grow.


10. Project Management

  • Which companies need to include PM as part of their enterprise architecture? In general, your enterprise architecture may not require project management software unless you execute these projects for your core business operations. For example, the ad-hoc engineering projects executed to improve processes or a CapEx building would not be part of your enterprise architecture. In other words, they can remain siloed. As far as the scope of enterprise architecture goes, these projects are applicable to businesses that sell them as their core offerings. These businesses include marketing agencies, defense contractors, sign manufacturers, or construction supply manufacturers.
  • Why do you need project management software? Generally, most project-centric organizations seem to be human-resources-driven. And these projects need to be estimated accurately and monitored throughout the process to avoid financial loss. So this is the core reason why PM software is critical for these organizations. 
  • Who needs to interact with project management software? Most commonly, these projects typically serve many different stakeholders. It could include the subject matter experts or individual contributors. It could also include project managers, estimators, and financial executives interested in the financial health of the project. 
  • Which capabilities do you need in the project management software? Typically, the capabilities crucial in project management software include resource scheduling, project governance, procurement, and timesheet management. You might also choose to go for packages such as timesheet software vs. project collaboration software.
  • What are the different options for project management software? Generally, there are two choices for project management software. For example, it can be standalone software or integrated with financials. In the startup phase, you might be OK with keeping it standalone. But as your project volume and scheduling complexity grow, you might need an option natively integrated with your financials.

9. Data Warehouse/Data Lake

  • Which companies need to include data warehouses as part of their enterprise architecture? Generally, most SMB companies might not include a data warehouse in their architecture. Because the operational systems crucial for their workflow take priority. However, once you have multiple systems in your architecture and struggle to get 360 degrees of your business due to the disparate data sources, you might need to include it in your architecture.
  • Why do you need data warehouse software? Typically, companies require a data warehouse when they need to consolidate insights from multiple systems, external or internal. Moreover, the drivers for data warehouses could be regulatory or forecasting. As well as for enabling decision support systems. It can also help them with historical data that is unavailable through their operational systems. Historical data typically gets lost when operational systems are replaced.
  • Who needs to interact with data warehouse software? In general, there are several stakeholders for data warehouse software. But the primary consumer would either be a BI tool. Or data scientists who might further augment the data and feed it back to the BI tool.
  • Which capabilities do you need in the data warehouse software? Depending upon the use case, several technologies are available to build a data warehouse or lake. But the most basic ones would be a separate data store. As well as ETL technology to move data nightly. The ETL technology helps avoid the impact on the operational performance due to the overhead exerted by the ETL pull.
  • What are the different options for data warehouse software? Generally, there are numerous technologies available to build data warehouses. But the easiest one would be to rent data warehouse capabilities, available through major cloud providers such as Azure, AWS, or GCP.

8. Business Intelligence (BI, S&OP, CPM, and ODP)

  • Which companies need to include business intelligence as part of their enterprise architecture? Typically, companies need business intelligence systems such as S&OP, CPM, and operational data platforms. They need it when they might have business performance issues such as inventory, cash flow, or waste in the manufacturing process. However, these systems are often siloed in SMB organizations unless offered pre-integrated with the ERP, etc. But as the complexity of your architecture and systems increase, you might need to integrate them.
  • Why do you need business intelligence software? Mostly, these analytical systems have pre-built workflows. These workflows can augment your datasets or allow additional dimensions such as seasonality to be added. They might also provide you with insights that might be harder with operational systems. It might be harder due to the rigidness of their data structure and impact on operations. In general, the role of business intelligence is to provide interactive analytics from data that you may have in your data warehouse.
  • Who needs to interact with business intelligence software? The consumers of business intelligence software are typically business users who need additional insights and KPIs for their workflow.
  • Which capabilities do you need in the business intelligence software? Generally, the main capabilities required in business intelligence software would be interactive analytics. And the analytical workflows to facilitate collaboration among business users.
  • What are the different options for business intelligence software? Typically, several options are available, with some offering their internal data store for the temporary storage of interim datasets. And the options could also be function specific. For example, a separate tool might be available for S&OP. Or the tool may offer connected planning as part of the suite.

7. Integration Technologies

  • Which companies need to include integration technologies as part of their enterprise architecture? Unless you have siloed systems or maintain everything in one system without additional channels, you may require an iPaaS. On the other hand, workflow collaboration would be an additional layer on top of the core operational architecture. You need it to enable master data control and ad-hoc workflows. Generally, Workflow collaboration tools don’t impact the enterprise architecture as much unless they are overused or overengineered.
  • Why do you need integration technologies? Essentially, integration technologies allow you to keep all your integration code in one place. Without an iPaaS, your choice would be to keep the integration code inside the source or destination system. And due to the additional overhead required, this choice may be more expensive to maintain over time. They might also be prone to bugs as the source and destination systems upgrade their interfaces. Additionally, the integration technologies allow safeguards if systems operate at different speeds.
  • Who needs to interact with integration technologies? Mainly, the integration technologies are used by developers or admins who need to ensure that integration flows work as expected.
  • Which capabilities do you need in the integration technologies? In general, the integration technologies must support various integration patterns such as HTTP, FTP, or Queue-based. It must also allow building an orchestration layer to transform and massage data in different formats.
  • What are the different options for integration technologies? Generally, there are several options available depending on the budget and capabilities. For example, if the company doesn’t want to utilize an iPaaS, they might host integration code in their existing data center or write it inside the source or destination system.

6. Manufacturing Software/MES

  • Which companies need to include manufacturing software as part of their enterprise architecture? Typically, These systems are applicable to manufacturing companies. They might use a separate MES system or a collection of tools that might serve a similar function as an MES. They also need a MES system if they have real-time integration with machines. We also need to collect and process operational data to optimize shop floor workflow. On the other hand, CAD, engineering, and R&D software typically have minimum impact on the enterprise architecture. The only cases where they might have an impact are when they need to be integrated with the operational flow to minimize data entry.
  • Why do you need manufacturing software? Since the shop floor is the primary cost driver for manufacturing companies, they need different tools to improve shop floor productivity. As the maturity of the shop floor and the order volume increase, they might need to integrate their shop floor technologies more.
  • Who needs to interact with manufacturing software? Typically, the primary stakeholders are plant floor users, supervisors, and manufacturing executives who need them for their operational workflow. 
  • Which capabilities do you need in the manufacturing software? In general, the shop floor capabilities might include scheduling and in-process inspections. As well as real-time integration and control of the machines, and engineering and R&D workflows.
  • What are the different options for manufacturing software? Mostly, the options could be siloed manufacturing software if your accounting function is completely siloed and disconnected from operations. It could also include an MES in conjunction. With an ERP, or a standalone manufacturing ERP (depending upon the company’s operational complexity).

5. Supply Chain Software (P2P, WMS, and TMS)

  • Which companies need supply chain software? It would depend upon your business model. If you have an extremely busy warehouse, WMS might be the first system you might introduce even before an ERP system. As the complexity of your business grows and order volume increases, you will be adding several specialized systems to your enterprise architecture, including TMS and P2P. Generally, systems such as strategic sourcing may not have as much impact on the enterprise architecture and can remain siloed.
  • Why do you need supply chain software? Most ERP systems may not be as efficient for warehouse or transportation operations. For example, suppose the out-of-the-box processes of ERP aren’t sufficient to meet the desired efficiency. Or integration requirements with warehouse equipment. In that case, you might need a specialized warehouse or transportation system.
  • Who needs to interact with supply chain software? Generally, the primary consumer of the supply chain systems would be warehouse operators and supervisors, logistics managers, and operations executives.
  • Which capabilities do you need in the supply chain software? The capabilities could be as simple as barcode scanning, rate shopping, or full-blown supply chain control tower capabilities to monitor the entire supply chain.
  • What are the different options for supply chain software? You have several options for supply chain management, with some software offering end-to-end traceability, including any exceptions as goods move through the supply chain. However, as the system complexity increases, you might need to select a specialized system for each area of the supply chain where you might have the most issues in your processes.

4. Human Capital Management

  • Which companies need to include human capital management as part of their enterprise architecture? Most companies start with essential payroll software that might be clubbed with an accounting system. However, as the number of employees grows in the organization and depending upon the criticality of human resources and compliance needs, you might need a specialized HCM system. The HR and HCM systems can remain siloed for SMBs as they don’t impact the enterprise architecture much. However, the integration may be required if you have HCM processes embedded as part of your operation flow, such as sales comp calculation.
  • Why do you need human capital management software? They need a specialized HCM system to meet each state and country’s compliance and reporting requirements. Generally, HR managers have one of the most complex recruiting, onboarding, and learning workflows, which drives the need for a specialized HCM system.
  • Who needs to interact with human capital management software? The primary consumers of the HCM systems are employees, HR managers, and finance executives. 
  • Which capabilities do you need in the human capital management software? The capabilities of an HCM system could include onboarding, training, skill development, performance management, and recruiting.
  • What are the different options for human capital management software? The options for HR and HCM could include simple payroll software or a full-blown HCM system to manage the needs of the entire HR department.


The 2025 Digital Transformation Report

Thinking of embarking on a ERP journey and looking for a digital transformation report? Want to learn the best practices of digital transformation? Then, you have come to the right place.

3. E-commerce and POS Platforms

  • Which companies need to include digital commerce as part of their enterprise architecture? Most companies selling products or services through retail locations or virtually would require several tools to enable their sales process. For example, if the order volume is too low, they might process the orders directly in the ERP or accounting software. 
  • Why do you need digital commerce software? If digital is your primary customer acquisition channel, you need tools designed to be efficient for the channel. For example, a POS system is designed for faster processing at retail locations. eCommerce platforms, on the other hand, have several capabilities tailored to the needs of digitally-savvy customers.
  • Who needs to interact with digital commerce software? These tools are primarily used by the sales and marketing teams to interact with and find customers.
  • Which capabilities do you need in digital commerce software? At a minimum, you need a content and commerce management system that allows you to build a decent web presence and optimize the site for search engines. Then, you might have more robust needs, such as digital asset management and a digital experience platform. It will also provide a product information management system to support experiences such as buy-online-pickup-in-store and omnichannel.
  • What are the different options for digital commerce software? There are several options available depending upon the digital maturity of the organization. As you grow your digital presence and revenue, you will be including specialized software such as product information management or digital experience management.

2. ERP and Accounting Software

  • Which companies need to include ERP as part of their enterprise architecture? The companies need an ERP system when siloed systems become a bottleneck to their growth and require substantial admin efforts to enter data in multiple systems. Companies that might be below $10 million in revenue might be able to manage without a fully integrated ERP
  • Why do you need ERP software? The ERP systems are designed for a cross-departmental operational workflow where the alignment of multiple functions such as sales, finance, procurement, and operations is necessary to deliver goods and services timely. And the ERP systems offer cross-departmental insights and KPIs that would be inaccurate and require substantial efforts with siloed systems.
  • Who needs to interact with ERP software? Everyone who touches the operational core, including sales, operations, finance, and procurement, might interact with an ERP system. 
  • Which capabilities do you need in the ERP software? At a minimum, an ERP system could include sales order processing, AR, AP, GL, purchase order processing, cost accounting, manufacturing, and project management. ERP systems typically don’t have operational capabilities for HR, marketers, and sales. Instead, they might use specialized software that integrates with ERP, such as HCM or CRM, for their operational workflow.
  • What are the different options for ERP software? There are several options available as the maturity of an organization grows, starting from essential accounting software to full-blown ERP systems. These systems might be able to manage most operational workflows where departments might overlap financially.

1. Customer Relationship Management

  • Which companies need to include CRM as part of their enterprise architecture? The smaller companies start with a standalone CRM system to manage their customer interactions until the point of order processing. Then, as the order volume grows, the CRM must be integrated with the ERP and eCommerce systems
  • Why do you need CRM software? CRM systems manage the entire workflow for sales and marketers during the pre-sales process. It starts with marketing automation, lead follow-up, and opportunity tracking. As well as quoting, customer journey builder, and marketing spend tracking. And finally, sales planning and forecasting, as well as territory management, are important.
  • Who needs to interact with CRM software? The primary consumer of CRM software is sales and marketing teams.
  • Which capabilities do you need in the CRM software? When you start, a small CRM with primary lead distribution and account tracking capabilities may be sufficient. But as you grow, you need more advanced marketing automation, territory planning, and quote management capabilities.
  • What are the different options for CRM software? Several options are available, starting from standalone software for CRM and marketing automation. But as you grow, you will need at least the entire sales and marketing function to be integrated with at least light integration with the ERP system. 

Conclusion

With these systems, you are touching the surface of the complexity of enterprise architecture. As the technologies mature and operational complexity increases with ever-growing customer expectations, the enterprise architecture will likely play a more significant role in the enterprise system design.

So when you are looking at a new system next time, think about how the system might fit in the architecture. And what you need to do to ensure that the data integrity across your enterprise architecture is maintained. And hopefully, this post has given you some insights into how each system fits into the digital architecture.

FAQs

Top 10 Large Company ERP In 2024

Top 10 Large Company ERP in 2024

For large companies, selecting an ERP system is no longer about meeting functional specifications. Instead, it’s about their ability to handle the transactional capacity and cross-functional process throughput. Evaluating software-enabled processes’ throughput mirrors physical or human resources planning, commencing with the desired state and identifying necessary resources. Contrary to the misconception of infinite capacity in software systems, meticulous capacity planning is indispensable.

The critical determinant in cross-functional process throughput boils down to the choice between isolated and tightly integrated processes. Amidst variables like human resources interactions, reconciliation overhead, and the switchover effect, pinpointing the most financially efficient approach proves challenging. Consequently, companies adopt varied ERP implementation strategies—some favoring tightly integrated methods, others leaning towards slightly more best-of-breed approaches. Additional factors include the generation of journal entries per user interaction, driving system overhead, and the cycle time for cross-functional processes. Advocates for real-time to batch conversion exist, yet even in batch mode, time considerations take precedence. For example, an MRP run exceeding 5 hours could fracture SQL connections and disrupt planning schedules, underscoring the need for meticulous analysis and ERP selection aligned with these considerations.

Top 10 Large Company ERP in 2024 - Quadrant

While throughput assessment may seem scientific, persuading every department to use the same ERP system can cause political resistance and power struggles. Evolving desired states and extended implementation horizons are other challenges large organizations face, forcing them to treat ERP as the corporate financial ledger while allowing their subsidiaries to choose their systems. So, which systems prove optimal at this stage regardless of their choice of architecture? Let’s delve in.


ERP Selection: The Ultimate Guide

This is an in-depth guide with over 80 pages and covers every topic as it pertains to ERP selection in sufficient detail to help you make an informed decision.

Criteria

  1. Definition of a large company. More than $1B in revenue or more than 1000 employees. Might be publicly listed. Financial controls are a must for SOX compliance and public reporting. Finance takes over operational needs. Might be present in more than ten countries.
  2. Overall market share/# of customers. Higher market share among the large companies ranks higher.
  3. Ownership/funding. The more committed the management to the product roadmap for large companies, the higher it ranks on our list.
  4. Quality of development. The more cloud-native capabilities, the higher it ranks on our list.
  5. Community/Ecosystem. The larger the community with large companies, the higher it ranks on our list.
  6. Depth of native functionality for specific industries. The deeper the publisher-owned out-of-the-box functionality, the higher it ranks on our list.
  7. Quality of publicly available product documentation. The poorer the product documentation, the lower it ranks on our list. 
  8. Larger company market share. The higher the focus on large companies, the higher the ERP system ranks on our list.
  9. Ability to natively support diversified business models. The more diverse the product, the higher it ranks on our list.
  10. Acquisition strategy aligned with large companies. The more aligned the acquisitions are with the large companies, the higher it ranks on our list.
  11. User Reviews. The deeper the reviews from large companies, the higher the score for a specific product.
  12. Must be an ERP product. It can’t be an edge product such as QuickBooks, Freshbooks, Xero, Zendesk, HubSpot, or Salesforce. It also can’t be an add-on owned by ISVs or VARs that sits on top of other accounting platforms.


The 2025 Digital Transformation Report

Thinking of embarking on a ERP journey and looking for a digital transformation report? Want to learn the best practices of digital transformation? Then, you have come to the right place.

10. Workday/Certinia

Workday, initially tailored as an HCM solution for Fortune 1,000 accounts, finds its niche in industries with sizable white-collar workforces. While Workday serves well as a comprehensive ERP for large enterprises in sectors like tech, media, telecom, banks, retail, and financial services, its suitability diminishes for product-centric industries requiring deeper transactional depth in inventory, costing, and MRP processes. However, it can excel in product-centric scenarios in a best-of-breed architecture sitting atop a corporate financial ledger. 

Historically, Certinia served as an alternative for finance before Workday developed its financial module. Depending on architectural preferences, both Workday and Certinia would be fit for best-of-breed architecture in some industries or function as complete ERPs in others. Despite a lower market share as ERP, their unique presence secures the #10 position on this list.

Strengths
  1. Enterprise-grade best-of-breed capabilities. Workday and FinancialForce excel in HCM and PSA, respectively, in their target industries, sitting atop the corporate financial ledger such as SAP or Oracle.
  2. Proven for enterprise workloads. Both solutions have been proven for enterprise workloads where the Fortune 100 may process millions of journal entries per hour, only possible with the disconnected architecture. 
  3. Cloud-native. Both solutions are cloud-native, a huge plus for large enterprises aiming for superior cross-functional throughput.
Weaknesses
  1. Requires internal IT maturity. The executives with limited experience in building complex architecture might struggle to hire skilled experts.
  2. Requires discipline with master data governance. The inability to build cross-functional with master data governance and cross-functional integration workflows might be counterproductive.
  3. Expensive. While operationally efficient, best-of-breed architecture is likely to be the most expensive of all, with substantial integration and maintenance costs in the long term.

9. QAD

QAD, a supply chain-focused manufacturing solution, caters to large automotive, F&B, and high-tech companies. Ideal as a subsidiary-level solution or as a corporate ERP for lower enterprise markets, it suits firms seeking robust functionality in supplier collaboration and international trade. Although a legacy solution, QAD has announced its plans to rearchitect the solution on a modern tech stack. However, its smaller size may pose challenges with transactional processing for larger accounts, and its niche nature could be limiting for enterprises with diverse operational models. Considering these factors, QAD secures the #6 rank among large company ERP systems.

Strengths
  1. Pre-integrated best-of-breed suite tailored for specific micro-verticals. QAD shines in specific micro-verticals where the generalized BOMs and recipes of vanilla solutions might struggle, especially beneficial as a subsidiary solution of large enterprises.
  2. ERP + Supply Chain Suite. QAD is perhaps the only suite that combines the capabilities of both suites, especially beneficial in architecture with disconnected supply chain planning at the plant level.
  3. Multi-entity Support. QAD would be a great fit for enterprises that want to consolidate some entities relevant to supply chain planning while keeping the remaining integrated through the corporate financial ledger.
Weaknesses
  1. Limited focus. The limited focus might be a challenge for enterprises planning to host all of their entities in one solution, requiring an upgrade to a more diverse solution. 
  2. Limited ecosystem. QAD’s ecosystem is substantially limited, causing issues with global rollout in countries with limited local talent.
  3. Technology. While QAD plans to redesign its entire platform, moving away from legacy technologies such as RPG, it might take a few years before it fully stabilizes.

8. Sage X3

Sage X3 is suitable for enterprises in the agriculture, F&B, and process manufacturing industries as a subsidiary-level best-of-breed solution, sitting atop SAP or Oracle– or, as a corporate solution for lower enterprises. With one of the strongest security and financial traceability, it could be a great fit for publicly traded or audit-ready companies in the lower enterprise market. However, it’s not proven with the upper enterprise market, particularly those necessitating millions of journal entries per hour. Despite these considerations, it secures the #8 spot among large company ERP systems.

Strengths
  1. Great for enterprise pharma and agriculture companies. Last mile capabilities for pharma, agriculture, and process-centric companies as a subsidiary solution atop a corporate financial ledger such as SAP or Oracle.
  2. Deep ERP layers for audit-ready and public companies. Ideal as a complete ERP solution, especially in the process-centric companies in the lower enterprise market.
  3. Great ecosystem of consultants for pharma validation. The ecosystem includes consulting companies with deep expertise in the Sage X3 product and validation procedures.
Weaknesses
  1. Limited focus. The limited focus of the solution might be a challenge for enterprises active with the M&A cycle and using it as a corporate solution with the desire to host all of their entities in one solution. 
  2. Not proven for the larger enterprise market. While great for the lower enterprise market and as a subsidiary solution, it’s not a great fit as a corporate solution for the upper enterprise market.
  3. Limited best-of-breed capabilities. Enterprise companies looking for pre-integrated best-of-breed options may struggle to find those options with Sage X3.

7. Unit4

Unit4, a robust ERP system, specifically targets large educational institutions and public-sector entities. Its forte lies in people-centric functionality augmented by enterprise-grade ERP capabilities. Noteworthy is Unit4’s unique standing, offering enterprise-grade functionalities for student information and teacher workflow management, setting it apart in the market. Proven in handling substantial workloads, Unit4 boasts successful implementations in some of the largest universities and public sector organizations, traditionally domains of Oracle Cloud ERP, Workday, or Microsoft Dynamics 365 F&O. Despite being rearchitected for a cloud-native experience, Unit4 remains a legacy product.

While primarily a European solution, Unit4 ensures localization and globalization for numerous countries. However, its challenge lies in accommodating diverse business models, making it less suitable for companies acquiring entities with varied business models, securing the #7 position on our list of large company ERP systems.

Strengths
  1. Enterprise-grade capabilities for universities and non-profits. Perhaps the only solution in this space that has depth in the public sector space, requiring substantial consulting efforts atop vanilla solutions.
  2. Cloud capabilities. While the solution is legacy, they have made substantial progress with their cloud capabilities. 
  3. Pre-integrated HCM and procurement processes tailored for service-centric industries. Solutions such as Workday that offer best-of-breed HCM and indirect procurement capabilities might be technically and financially risky.
Weaknesses
  1. Limited focus. The limited focus of the solution might be a challenge for enterprise companies active with M&A cycles, especially for business models outside of Unit4’s expertise. 
  2. Limited ecosystem and consulting base. As of today, their North American presence and consulting base is significantly limited.
  3. Limited best-of-breed capabilities. Enterprise companies opting to build best-of-breed architecture might not find as many pre-baked integration options, requiring substantial consulting efforts.

6. Deltek

Deltek caters to major government contractors, AE, and construction companies, serving as an ideal subsidiary solution for large enterprises or as a corporate solution for lower enterprise segment planning to host all of their global entities in one database. Tailored for these industries, Deltek offers unique capabilities, leveraging industry-specific databases and integrations, which is particularly crucial for processes like CPQ. While excelling in deep capabilities for certain industries, Deltek is not as complete as an ERP as other solutions on this list, necessitating additional integrations. Despite its focused scope, recent developments have influenced its ranking, securing the #6 position among large company ERP systems.

Strengths
  1. Last-mile capabilities for GovCon and construction-centric verticals. Deltek has last-mile capabilities in the construction and GovCon space, making it an ideal subsidiary solution for large enterprises.
  2. Access to the databases and networks relevant to these industries. Deltek has several products in its portfolio with industry databases and networks that would be much harder to build atop vanilla solutions because of the subject matter expertise required in these industries.
  3. Multi-entity capabilities. Their multi-entity capabilities are rich, making them suitable for lower enterprise companies seeking a corporate solution to host all of their entities in one database.
Weaknesses
  1. Limited focus. The limited focus of the solution might be a challenge for enterprise companies active with M&A cycles, especially for business models outside of Deltek’s expertise. 
  2. Limited ecosystem and consulting base. As of today, their ecosystem and consulting base is significantly limited.
  3. Not proven for the larger enterprise market. While great for the lower enterprise market and as a subsidiary solution, it’s not a great fit as a corporate solution for the upper enterprise market.

5. Infor CloudSuite M3/LN

Infor LN and M3, distinct products bundled into CloudSuite offerings, share our list’s ranking due to their non-overlapping target markets. While Infor CloudSuite LN focuses on discrete-centric verticals like aerospace and automotive, Infor M3 caters to industries such as apparel and food and beverage. Both offer comprehensive manufacturing solutions for global organizations with diversified manufacturing business models, including essential components like PLM and industry-specific quality features. Positioned as subsidiary solutions for the upper enterprise market or corporate solutions for the lower enterprise market, they secure the #5 spot among large ERP systems.

Strengths
  1. Great for lower enterprise companies as pureplay manufacturing business models. Ideal for lower enterprise companies as a corporate solution or as a subsidiary solution for upper enterprise, publicly traded, private equity-owned, or holding companies.
  2. Most comprehensive manufacturing capabilities. Both can support the most complex manufacturing business models for global companies exploring operational synergies across global entities. 
  3. Enterprise-grade capabilities for lower enterprise companies. While most smaller solutions might require ad-hoc arrangements for global financial operations, both have them natively built.
Weaknesses
  1. Not the best fit as a corporate ledger. Large enterprises, private equity, or holding companies requiring global solutions while using a tier-2 solution at the subsidiary level might not find the most value with both.
  2. Limited focus. The limited focus on certain business models poses the risk of requiring other ERP systems to support complex and diverse business operations.
  3. Limited ecosystem and consulting base. The consulting base is highly limited, primarily relying on very few Infor resellers for consulting and support.

4. IFS

IFS focuses on large enterprises in the airline, MRO, construction, oil and gas, and heavy equipment field service sectors, offering strong ERP, EAM, field service, and enterprise project management capabilities. Suited for large enterprises seeking best-of-breed solutions, IFS can sit atop financial ledgers like SAP or Oracle or serve as a subsidiary solution. Despite notable progress in North America, its install base is comparatively limited. With recent growth in enterprise adoption, IFS secures the #4 position on our list.

Strengths
  1. Enterprise-grade field service and asset management capabilities. This is especially suitable for upper enterprise companies seeking best-of-breed capabilities with field service and asset management.
  2. The data model is aligned with companies with large programs. Industries such as MRO, Oil, and Gas follow very different project structures and BOMs. And IFS’s data model allows them to manage complex programs without any ad-hoc arrangements.This is especially beneficial for lower enterprise companies looking for last-mile capabilities pre-baked with the solution. 
  3. Technology – While a legacy solution, IFS technology has been rearchitected and modernized using cloud-native SaaS technologies.
Weaknesses
  1. Limited focus. The limited focus might be a challenge for enterprise companies active with M&A cycles. 
  2. Limited ecosystem. Its presence and install base are still limited in North America compared to other solutions on this list.
  3. Not proven for the larger enterprise market. While great as a best-of-breed solution for field service or EAM, it’s not proven for the workload of Fortune 1000 companies.

3. Microsoft Dynamics 365 Finance & Operations

Microsoft Dynamics 365 F&O is perhaps the most diverse solution accommodating several global business models in one database, making it an ideal solution for lower enterprise companies seeking a corporate solution to host all of their entities in one database. While a great fit as a corporate ledger for large enterprises, it’s not as proven as other leading solutions in the enterprise market with workloads as high as millions of journal entries per hour that Fortune 1000 companies might demand. Given these considerations, it secures the #3 spot on our large company ERP systems list.

Strengths
  1. Diverse capabilities.Supports global operations and business models and pre-baked integration for the best-of-breed CRM and field service solutions.
  2. Ecosystem. This is especially beneficial for private equity and holding companies trying to streamline all of their entities on one solution. They can find add-ons if the core solution doesn’t meet their needs for last-mile industry capabilities.
  3. Global capabilities. Global capabilities would help enterprise companies in countries with its limited presence or support, making it a truly global solution compared to other platforms on this list.
Weaknesses
  1. The channel is not as regulated. Microsoft channel is very complex, without any direct support for its resellers and partners, making navigating the Microsoft channel extremely hard.
  2. Limited best-of-breed capabilities directly through OEM. While Microsoft Dynamics 365 F&O has a vibrant marketplace to augment its core capabilities, crucial capabilities such as PLM, etc, might not be owned and pre-integrated by Microsoft.
  3. Limited last-mile capabilities. The last-mile capabilities required in specific micro-verticals such as dairy, plastic, building supplies, or metal might require add-ons or expensive development on top of the core platform.

2. Oracle Cloud ERP 

Ideal for large enterprises in service industries, Oracle Cloud ERP stands out as a top choice as a corporate financial ledger within best-of-breed architectures, whether for publicly traded or privately owned entities. While excelling as a financial ledger, its suitability as a subsidiary solution in best-of-breed setups is limited due to over-bloated global capabilities and leaner last-mile functionalities compared to other solutions on the list. Given these considerations, Oracle Cloud ERP claims the #2 spot among large company ERP systems.

Strengths
  1. Robust finance capabilities for large, global enterprises. Capabilities include having five layers of GL restrictions, multiple layers of sub-ledgers, and book closing requirements across divisions, making an ideal corporate ledger for complex global enterprises.
  2. Proven solution as a corporate ledger with Fortune 1000 workloads. It can handle the workload of large enterprises processing millions of GL entries per hour. 
  3. Ecosystem.  Oracle Cloud ERP has an ecosystem of experienced consultants capable of handling the architecture of such complex enterprises.
Weaknesses
  1. Global transactional and financial traceability are not as intuitive. While functionally capable, transactional and financial traceability might not be as intuitive for large, complex enterprises.
  2. It may not be the best fit for large enterprises with complex transactions or Fortune 1000 global MRP workloads. While great as a financial ledger, complex products with serialized structures or large enterprises with very complex BOMs with operational and financial synergies among entities might struggle with the solution because of the workload requirements at this scale.
  3. Not the best fit as a subsidiary solution. There are better solutions on this list that can offer much deeper operational capabilities at the subsidiary level without the overloaded complex financial layers of Oracle Cloud ERP.

1. SAP S/4 HANA

SAP S/4 HANA is among the few solutions with capabilities to handle the workload expectations of most complex products with global MRP runs, making it ideal as a corporate ledger for most enterprise companies, publicly or privately owned, or as a corporate ERP for globally integrated product-centric industries, regardless of their design including shared services. Despite its enterprise-grade capabilities, it is not as suitable for enterprises seeking deeper operational capabilities at the subsidiary level. Given these considerations, it secures the #1 rank among large ERP systems.

Strengths
  1. Robust finance capabilities for large, global enterprises. Capabilities include several financial hierarchies to support complex, global organizations without requiring ad-hoc arrangements for global traceability or consolidations.
  2. Proven solution with the most detailed enterprise-grade MRP strategy for global planning. Globally connected enterprises with shared product models and dependencies among entities, SAP S/4 HANA, can handle most complex planning configurations without the requirement of decoupling the transactions.
  3. Intuitive global transactional and financial traceability. It is one of the most intuitive ERP products for such complex operations with its transactional maps capabilities built with the products, making debugging complex financial enterprises easier.
Weaknesses
  1. Behind in cloud ERP capabilities. Despite advanced financial traceability and technical capabilities, the functional capabilities are not as rich as with its on-prem version.
  2. Not the best fit as a subsidiary solution. There are better solutions on this list that can offer much deeper operational capabilities at the subsidiary level without the over-bloated complex financial and enterprise layers.
  3. Limited last-mile capabilities. In industries where it might not be the most frequently installed as an operational solution, the other solutions are likely to have deeper last-mile capabilities.

Conclusion

Transitioning into the $1B club brings unique challenges like navigating multiple country regulations, cash flow intricacies, currency hedging, and international supply chain complexities—issues less prevalent in mid-market companies

Deploying systems designed for smaller enterprises may lead to financial control shortcomings. Large companies should avoid squeezing into ill-fitting solutions and explore options tailored to their specific needs. Let this list guide you in narrowing down suitable ERP choices for your enterprise with the help of independent ERP consultants.

FAQs

FREE RESOURCE

<span data-metadata=""><span data-buffer="">2025 Digital Transformation Report

This digital transformation report summarizes our annual research on ERP and digital transformation trends and forecasts for the year 2025. 

Send this to a friend